

Question: The time spent studying for a test and the test scores are graphed below along with the best fit line 100 90 Exam score e

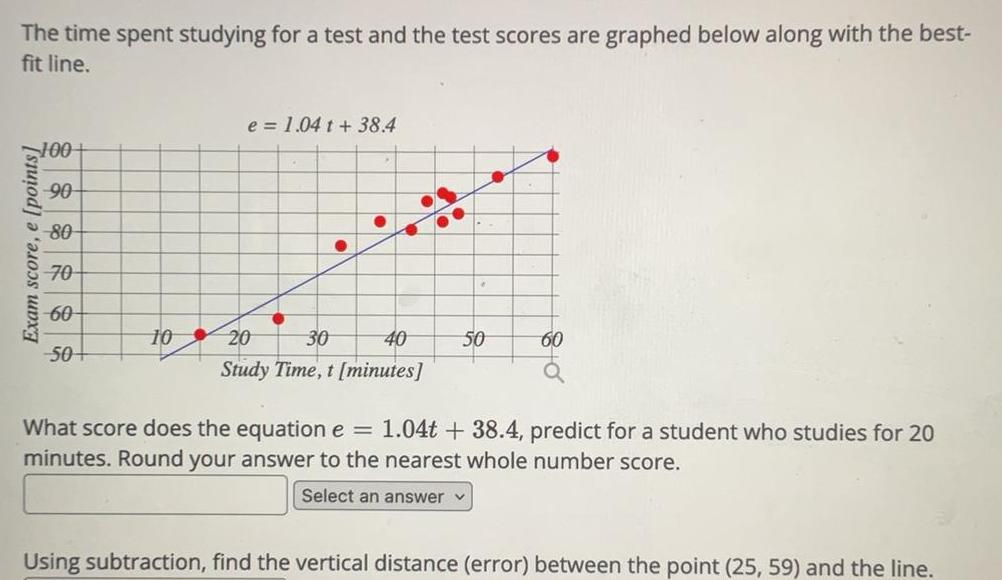
The time spent studying for a test and the test scores are graphed below along with the best fit line 100 90 Exam score e points 80 70 60 50 10 e 1 04 t 38 4 20 30 40 Study Time t minutes 50 60 What score does the equation e 1 04t 38 4 predict for a student who studies for 20 minutes Round your answer to the nearest whole number score Select an answer Using subtraction find the vertical distance error between the point 25 59 and the line
Step by Step Solution
There are 3 Steps involved in it
1 Expert Approved Answer
Step: 1 Unlock

Question Has Been Solved by an Expert!
Get step-by-step solutions from verified subject matter experts
Step: 2 Unlock
Step: 3 Unlock