

Question: The tracking signals computed using past demand history for three different products are as follows. Each product used the same forecasting technique. a. Graph the
The tracking signals computed using past demand history for three different products are as follows. Each product used the same forecasting technique.
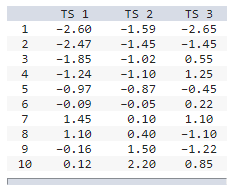
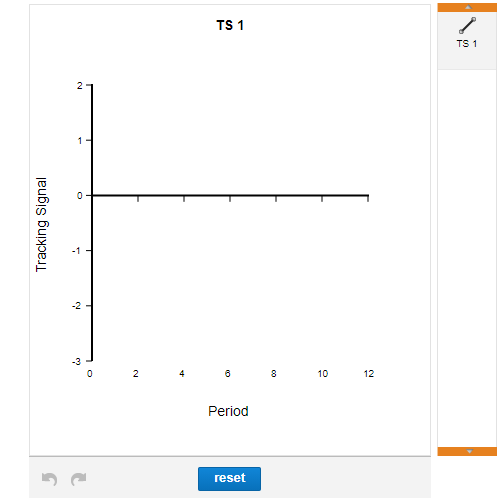
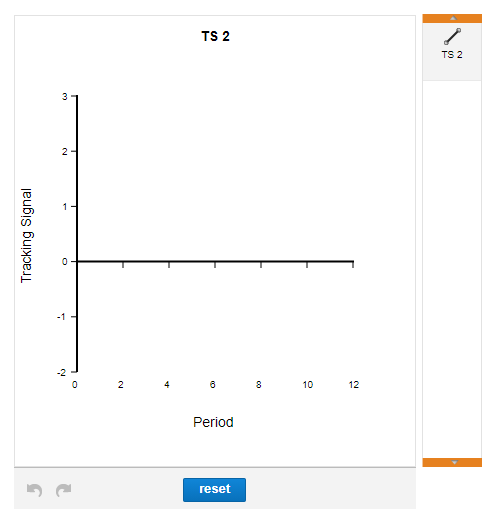
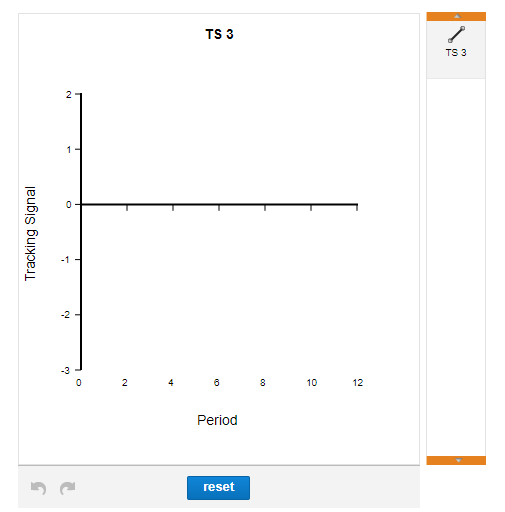
a. Graph the tracking signals for each product.
Instructions: 1. Use the line tool to draw the tracking signals (TS1, TS2, TS3) for each product. 2. To earn full credit for this graph you must plot all required points, beginning with the first unit. 3. To enter exact coordinates, double click on the point and enter the values of x and y.
Step by Step Solution
There are 3 Steps involved in it
1 Expert Approved Answer
Step: 1 Unlock

Question Has Been Solved by an Expert!
Get step-by-step solutions from verified subject matter experts
Step: 2 Unlock
Step: 3 Unlock