

Question: The tracking signals computed using past demand history for three different products are as follows. Each product used the same forecasting technique 1 2 3
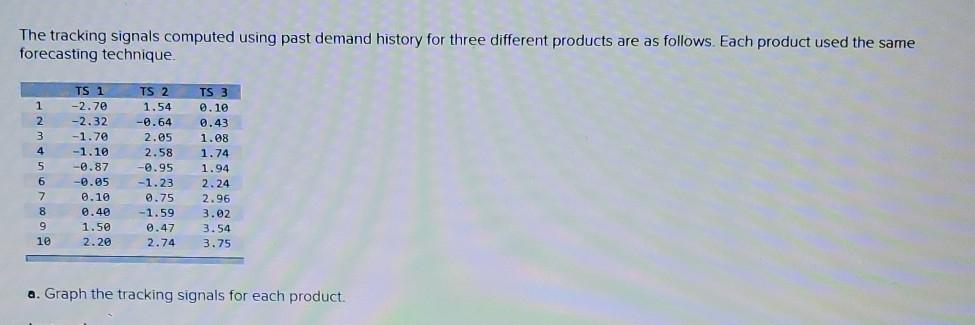
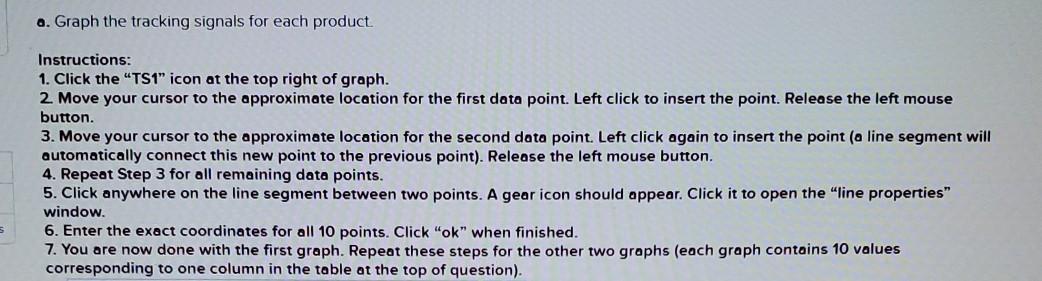
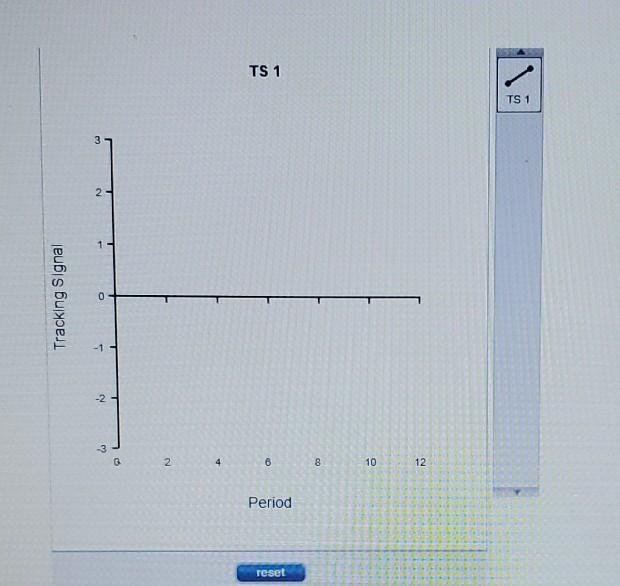
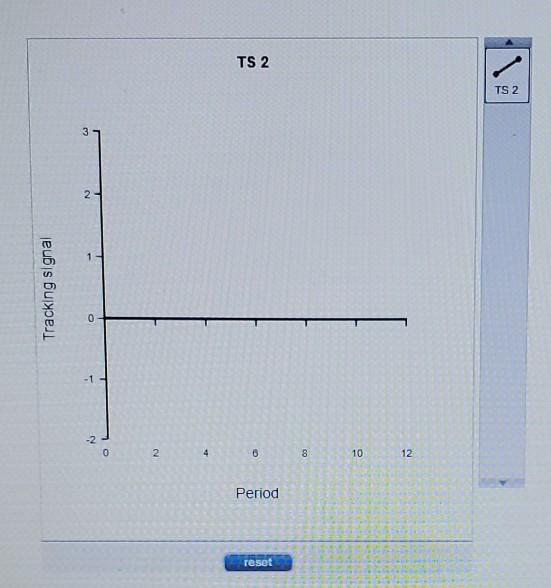
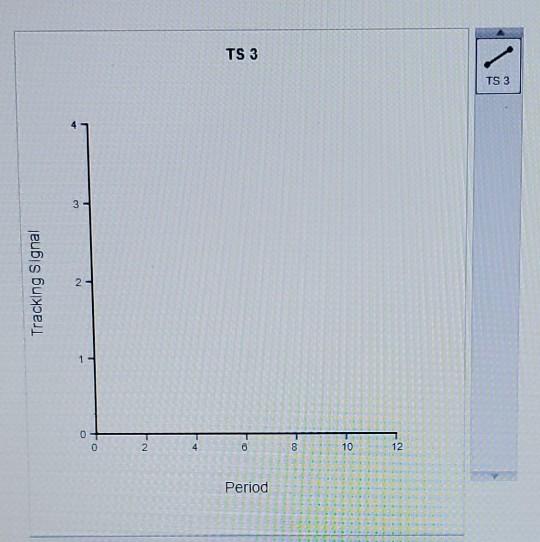
The tracking signals computed using past demand history for three different products are as follows. Each product used the same forecasting technique 1 2 3 4 5 6 7. 8 9 10 TS 1 -2.70 -2.32 -1.70 -1.10 -0.87 -0.05 0.10 0.40 1.50 2.20 TS 2 1.54 -0.64 2.05 2.58 -0.95 -1.23 0.75 -1.59 0.47 2.74 TS 3 0.10 0.43 1.08 1.74 1.94 2.24 2.96 3.02 3.54 3.75 a. Graph the tracking signals for each product a. Graph the tracking signals for each product Instructions: 1. Click the "TS1" icon at the top right of graph. 2. Move your cursor to the approximate location for the first data point. Left click to insert the point. Release the left mouse button. 3. Move your cursor to the approximate location for the second data point. Left click again to insert the point (a line segment will automatically connect this new point to the previous point). Release the left mouse button. 4. Repeat Step 3 for all remaining data points. 5. Click anywhere on the line segment between two points. A gear icon should appear. Click it to open the line properties" window. 6. Enter the exact coordinates for all 10 points. Click "ok" when finished. 7. You are now done with the first graph. Repeat these steps for the other two graphs (each graph contains 10 values corresponding to one column in the table at the top of question). TS 1 TS 1 2 Tracking Signal 0 -1 -2 T -3 N 4 6 CO 10 12 Period reset TS 2 TS 2 3 2 Tracking signal O -1 -2 0 2 4 0 OD 10 12 Period reset TS 3 TS 3 3 Tracking Signal 2 0 0 NE 0 8 10 12. Period b. Comment on the above. Forecast TS 1 TS 2 TS 3
Step by Step Solution
There are 3 Steps involved in it
1 Expert Approved Answer
Step: 1 Unlock

Question Has Been Solved by an Expert!
Get step-by-step solutions from verified subject matter experts
Step: 2 Unlock
Step: 3 Unlock