

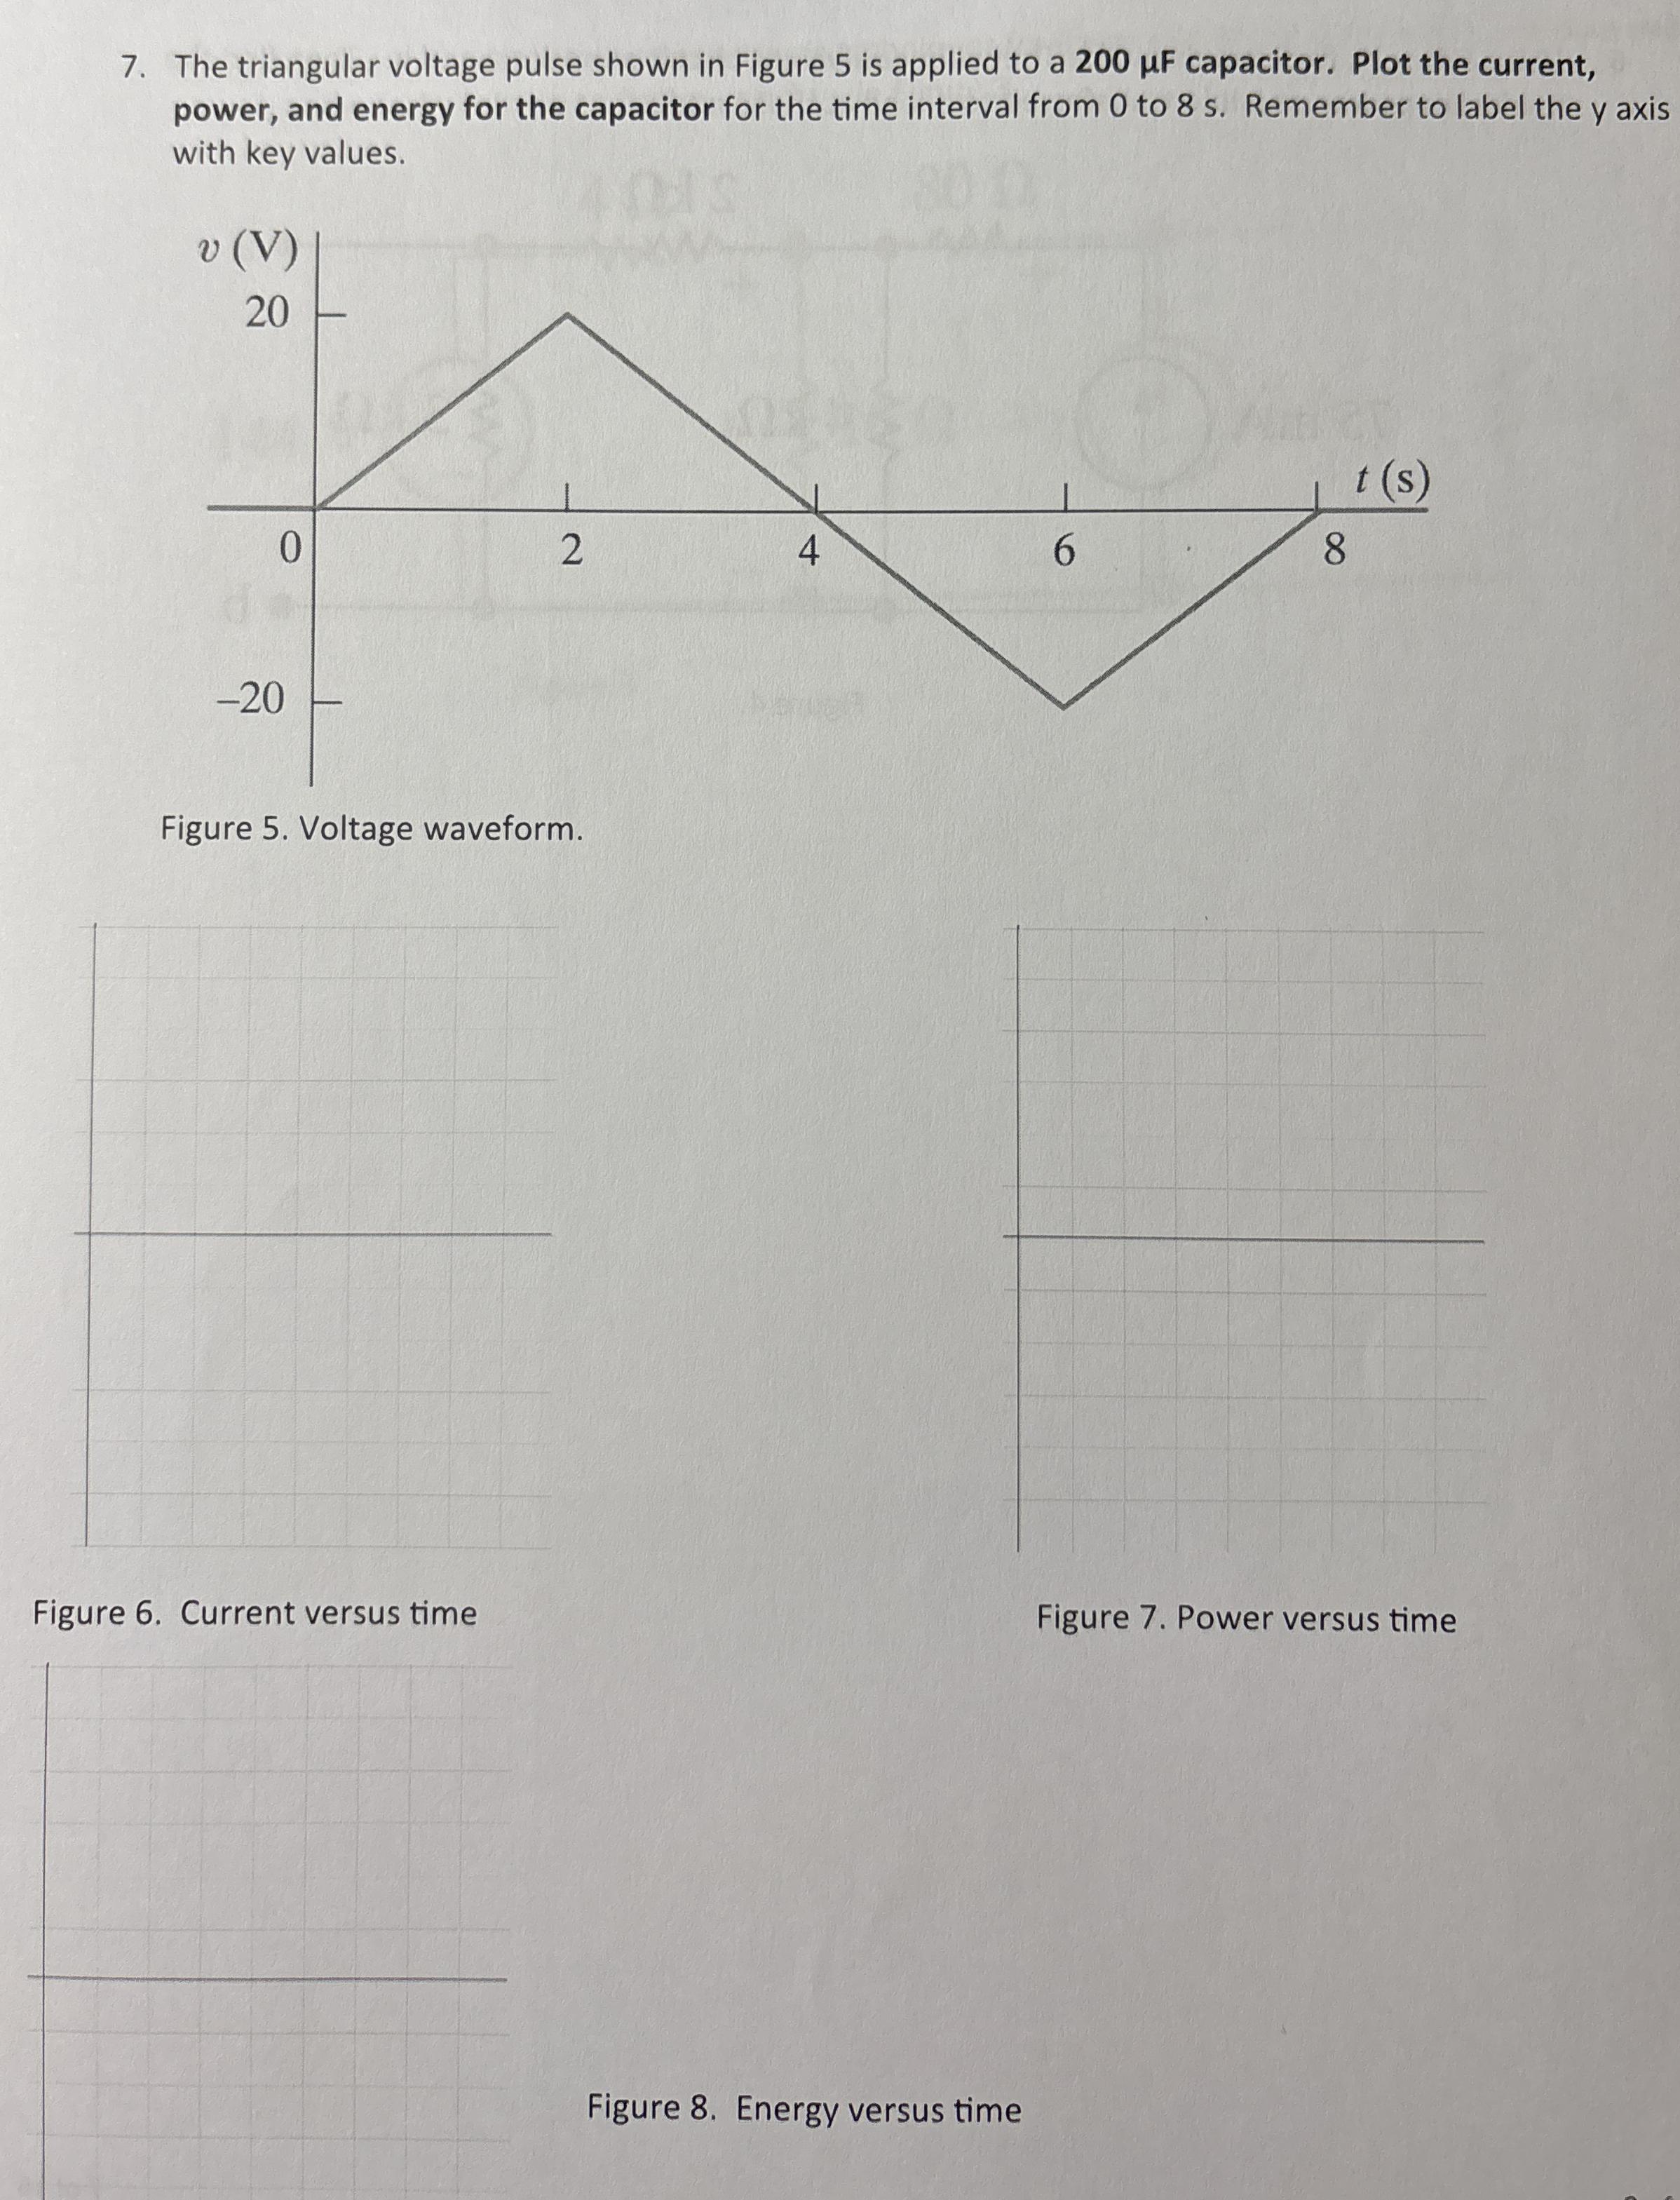
Question: The triangular voltage pulse shown in Figure 5 is applied to a 2 0 0 F capacitor. Plot the current, power, and energy for the
The triangular voltage pulse shown in Figure is applied to a capacitor. Plot the current, power, and energy for the capacitor for the time interval from to s Remember to label the axis with key values.
Figure Voltage waveform.
Figure Current versus time
Figure power versus time
Figure Energy versus time
Step by Step Solution
There are 3 Steps involved in it
1 Expert Approved Answer
Step: 1 Unlock

Question Has Been Solved by an Expert!
Get step-by-step solutions from verified subject matter experts
Step: 2 Unlock
Step: 3 Unlock