

Question: The two plots below have been extracted from the St Louis Fed database. They represent the monthly policy interest rate and the mortgage interest rate
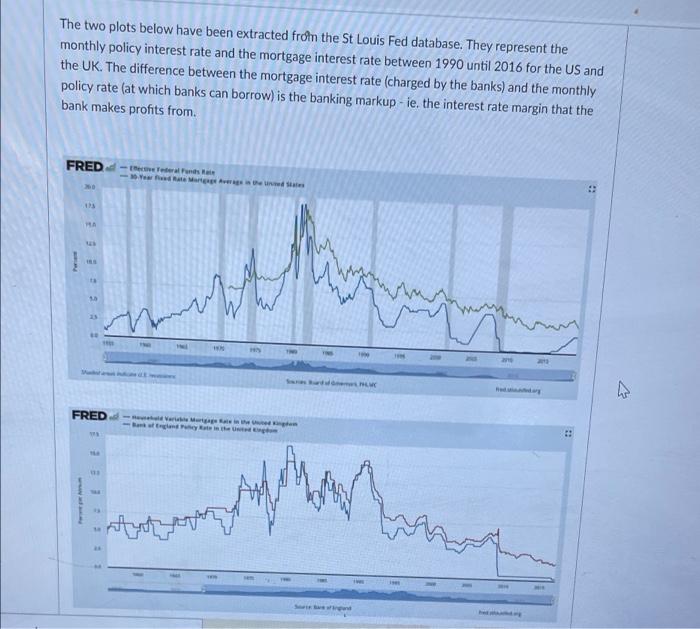
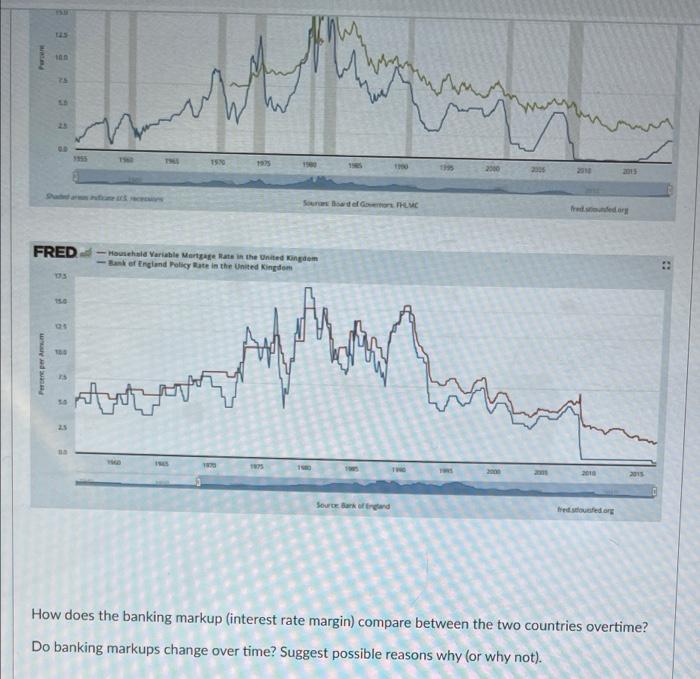
The two plots below have been extracted from the St Louis Fed database. They represent the monthly policy interest rate and the mortgage interest rate between 1990 until 2016 for the US and the UK. The difference between the mortgage interest rate (charged by the banks) and the monthly policy rate (at which banks can borrow) is the banking markup - ie, the interest rate margin that the bank makes profits from. FRED - Federal Funds - trees as but dar ws FRED . 113 styrore 10 2 19 1925 2015 Sou Badan THC dedor FRED -Hauschal Variable Mortgage Rate in the United Kingdom Bank of England Policy Rate in the United Kingdom 05 Myan Atmoet 25 19 2010 2015 Sourcer of trand frededor How does the banking markup (interest rate margin) compare between the two countries overtime? Do banking markups change over time? Suggest possible reasons why (or why not)
Step by Step Solution
There are 3 Steps involved in it

Get step-by-step solutions from verified subject matter experts