

Question: The two plots below have been extracted from the St Louis Fed database. They represent the monthly policy interest rate and the mortgage interest rate
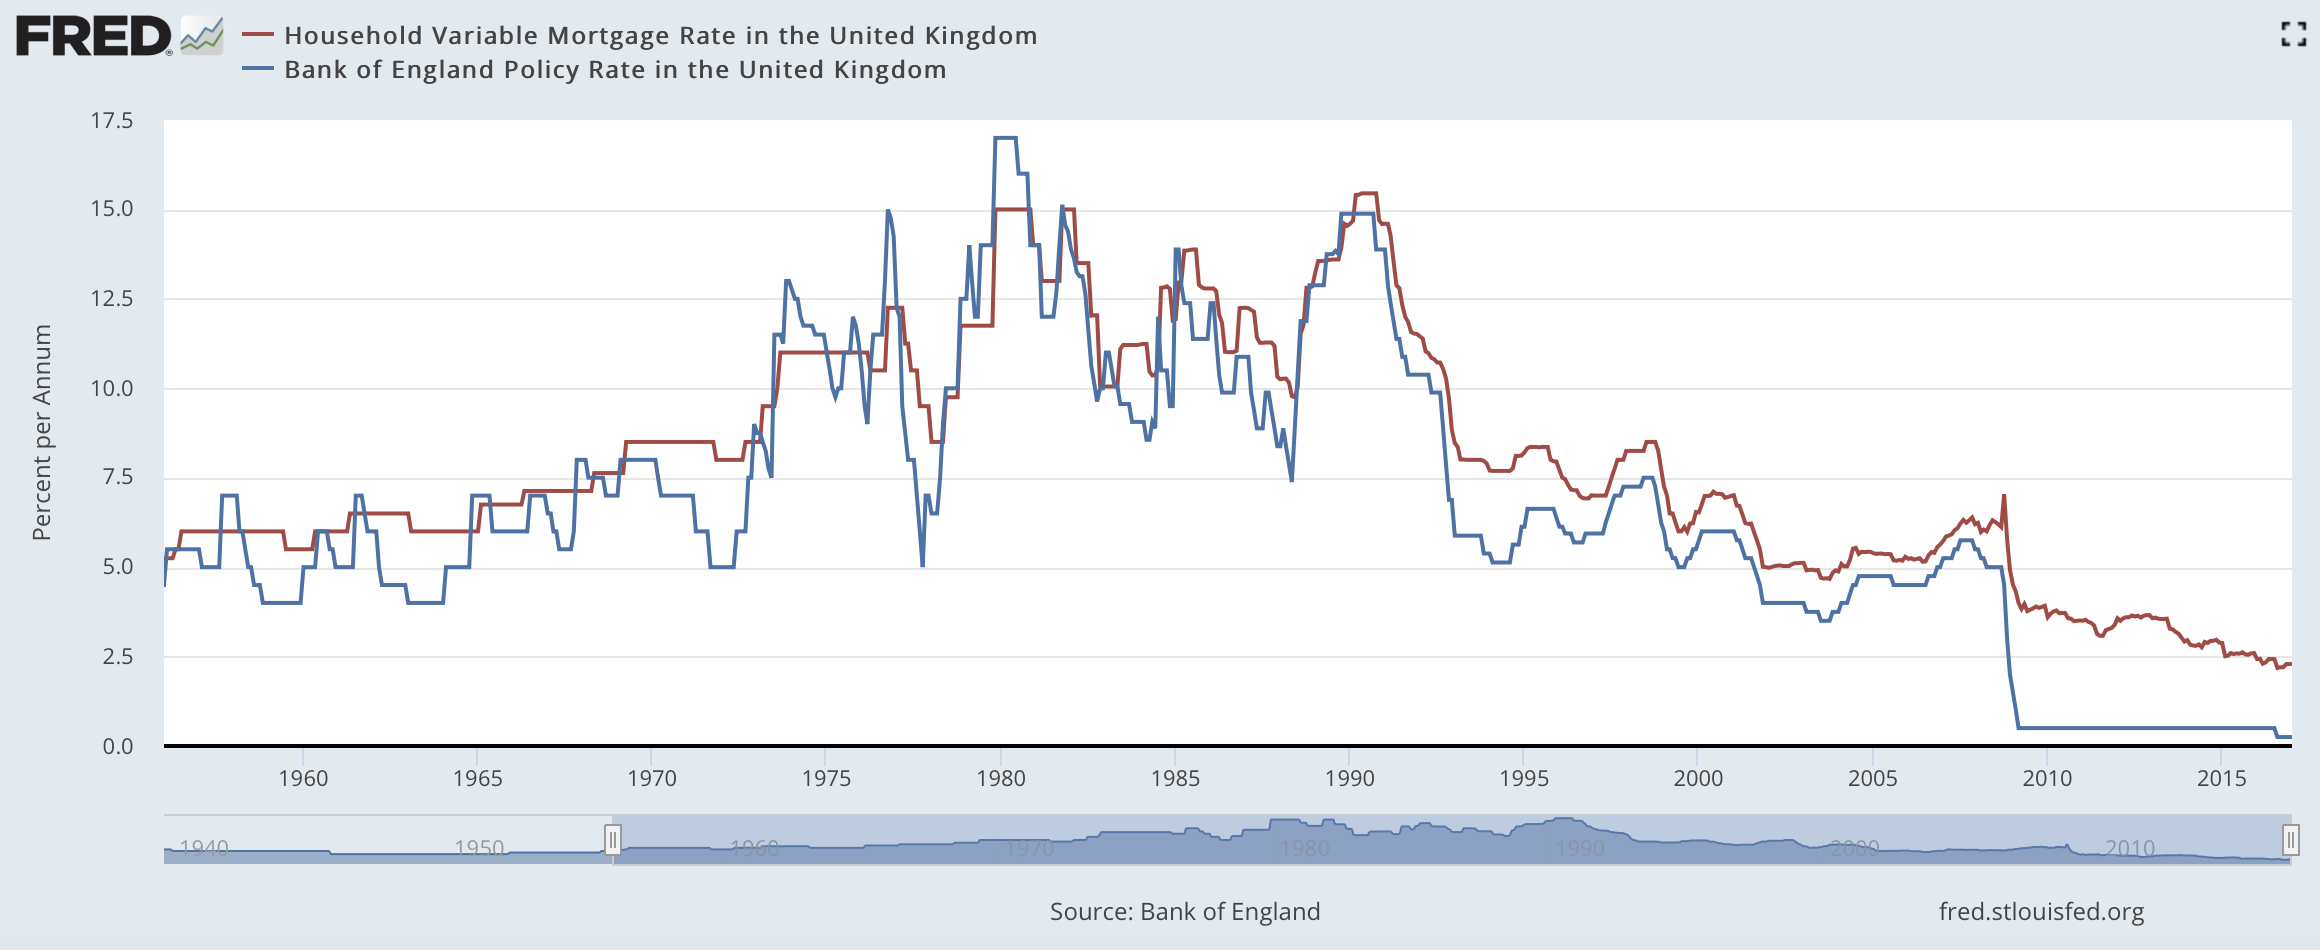
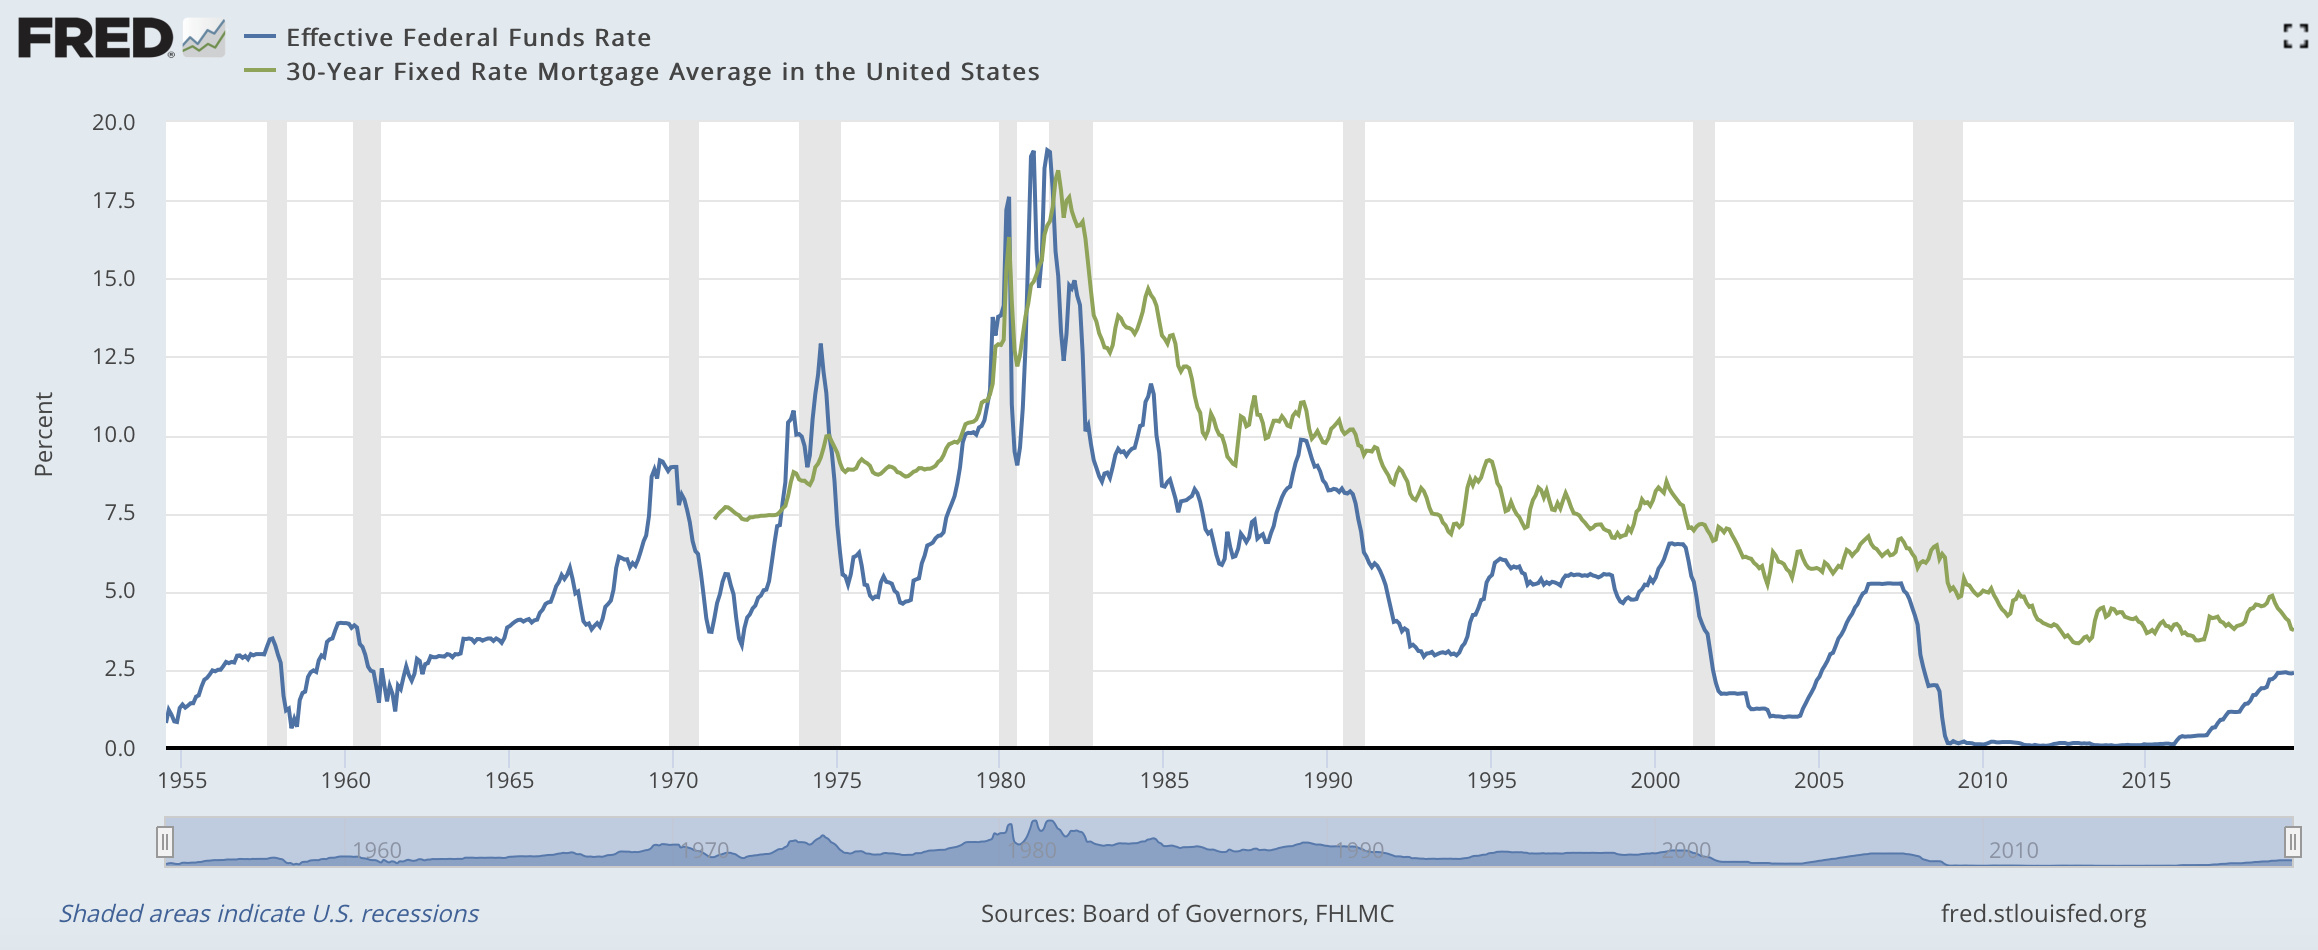 The two plots below have been extracted from the St Louis Fed database. They represent the monthly policy interest rate and the mortgage interest rate between 1990 until 2016 for the US and the UK. The difference between the mortgage interest rate (charged by the banks) and the monthly policy rate (at which banks can borrow) is the banking markup - ie. the interest rate margin that the bank makes profits from.
1) How does the banking markup (interest rate margin) compare between the two countries overtime?
2) Do banking markups change over time? Suggest possible reasons why (or why not).
FRED Household Variable Mortgage Rate in the United Kingdom Bank of England Policy Rate in the United Kingdom 17.5 15.0 12.5 10.0 - Percent per Annum 7.5 Ayo 5.0 2.5 0.0 1960 1965 1970 1975 1980 1985 1990 1995 2000 2005 2010 2015 1010 1950 LOCA 1980 1990 2000 2010 Source: Bank of England fred.stlouisfed.org FRED Effective Federal Funds Rate 30-Year Fixed Rate Mortgage Average in the United States 20.0 17.5 15.0 12.5 Percent han 10.0 7.5 un m 5.0 2.5 0.0 1955 1960 1965 1970 1975 1980 1985 1990 1995 2000 2005 2010 2015 1960 2000 2010 O Shaded areas indicate U.S. recessions Sources: Board of Governors, FHLMC fred.stlouisfed.org FRED Household Variable Mortgage Rate in the United Kingdom Bank of England Policy Rate in the United Kingdom 17.5 15.0 12.5 10.0 - Percent per Annum 7.5 Ayo 5.0 2.5 0.0 1960 1965 1970 1975 1980 1985 1990 1995 2000 2005 2010 2015 1010 1950 LOCA 1980 1990 2000 2010 Source: Bank of England fred.stlouisfed.org FRED Effective Federal Funds Rate 30-Year Fixed Rate Mortgage Average in the United States 20.0 17.5 15.0 12.5 Percent han 10.0 7.5 un m 5.0 2.5 0.0 1955 1960 1965 1970 1975 1980 1985 1990 1995 2000 2005 2010 2015 1960 2000 2010 O Shaded areas indicate U.S. recessions Sources: Board of Governors, FHLMC fred.stlouisfed.org
Step by Step Solution
There are 3 Steps involved in it

Get step-by-step solutions from verified subject matter experts