

Question: The two yield curves in the chart are from September 1 0 , 2 0 0 1 ( yellow line ) and from October 1
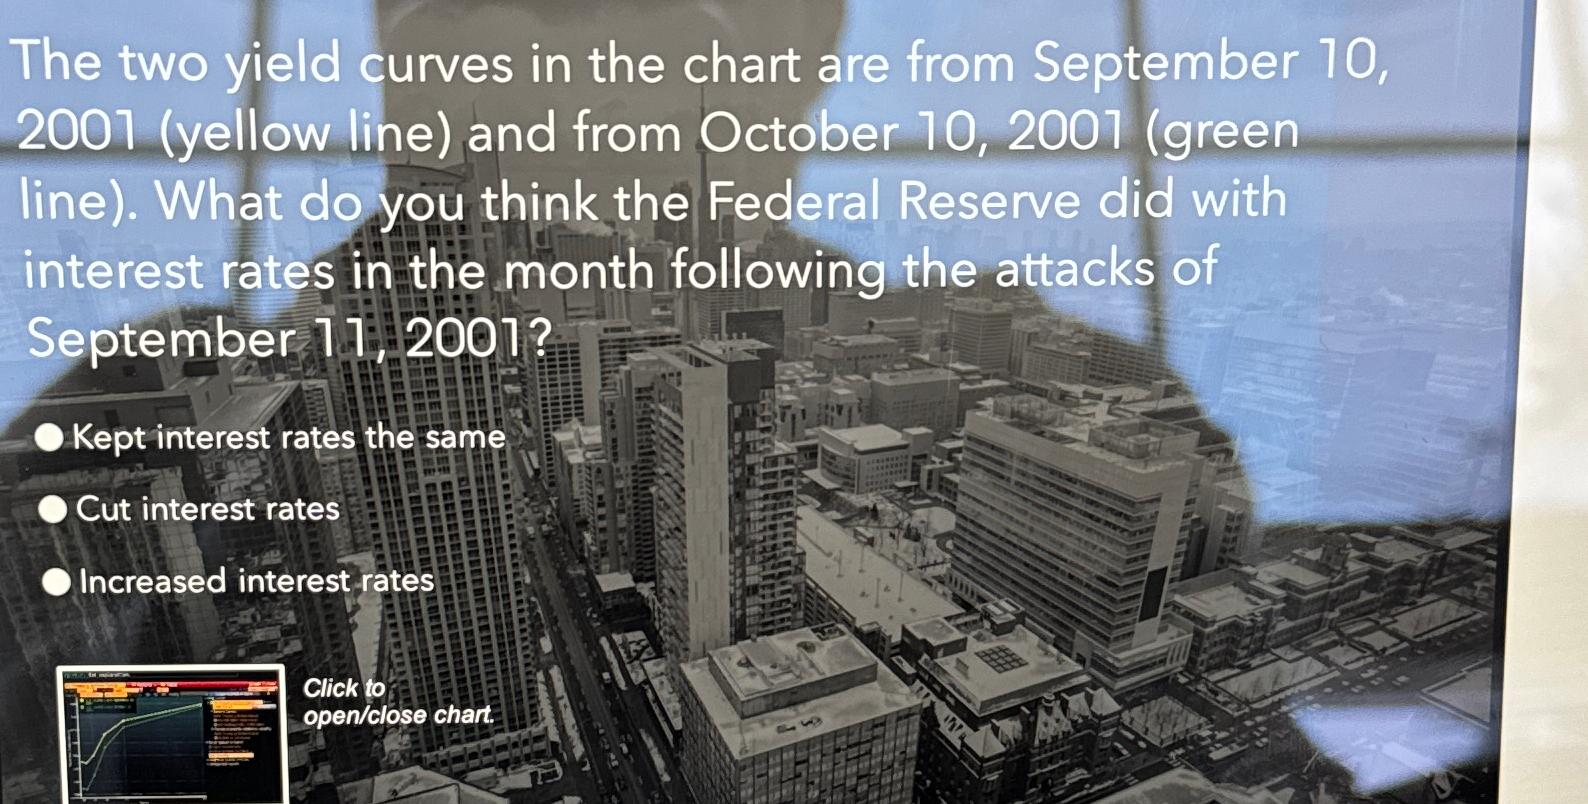
The two yield curves in the chart are from September yellow line and from October green line What do you think the Federal Reserve did with interest rates in the month following the attacks of September
Kept interest rates the same
Cut interest rates
lncreased interest rates
Step by Step Solution
There are 3 Steps involved in it
1 Expert Approved Answer
Step: 1 Unlock

Question Has Been Solved by an Expert!
Get step-by-step solutions from verified subject matter experts
Step: 2 Unlock
Step: 3 Unlock