

Question: The twoway table below represents the transportation that students take to school. a) (1 point) What is the joint relative frequency of Complete the two-way
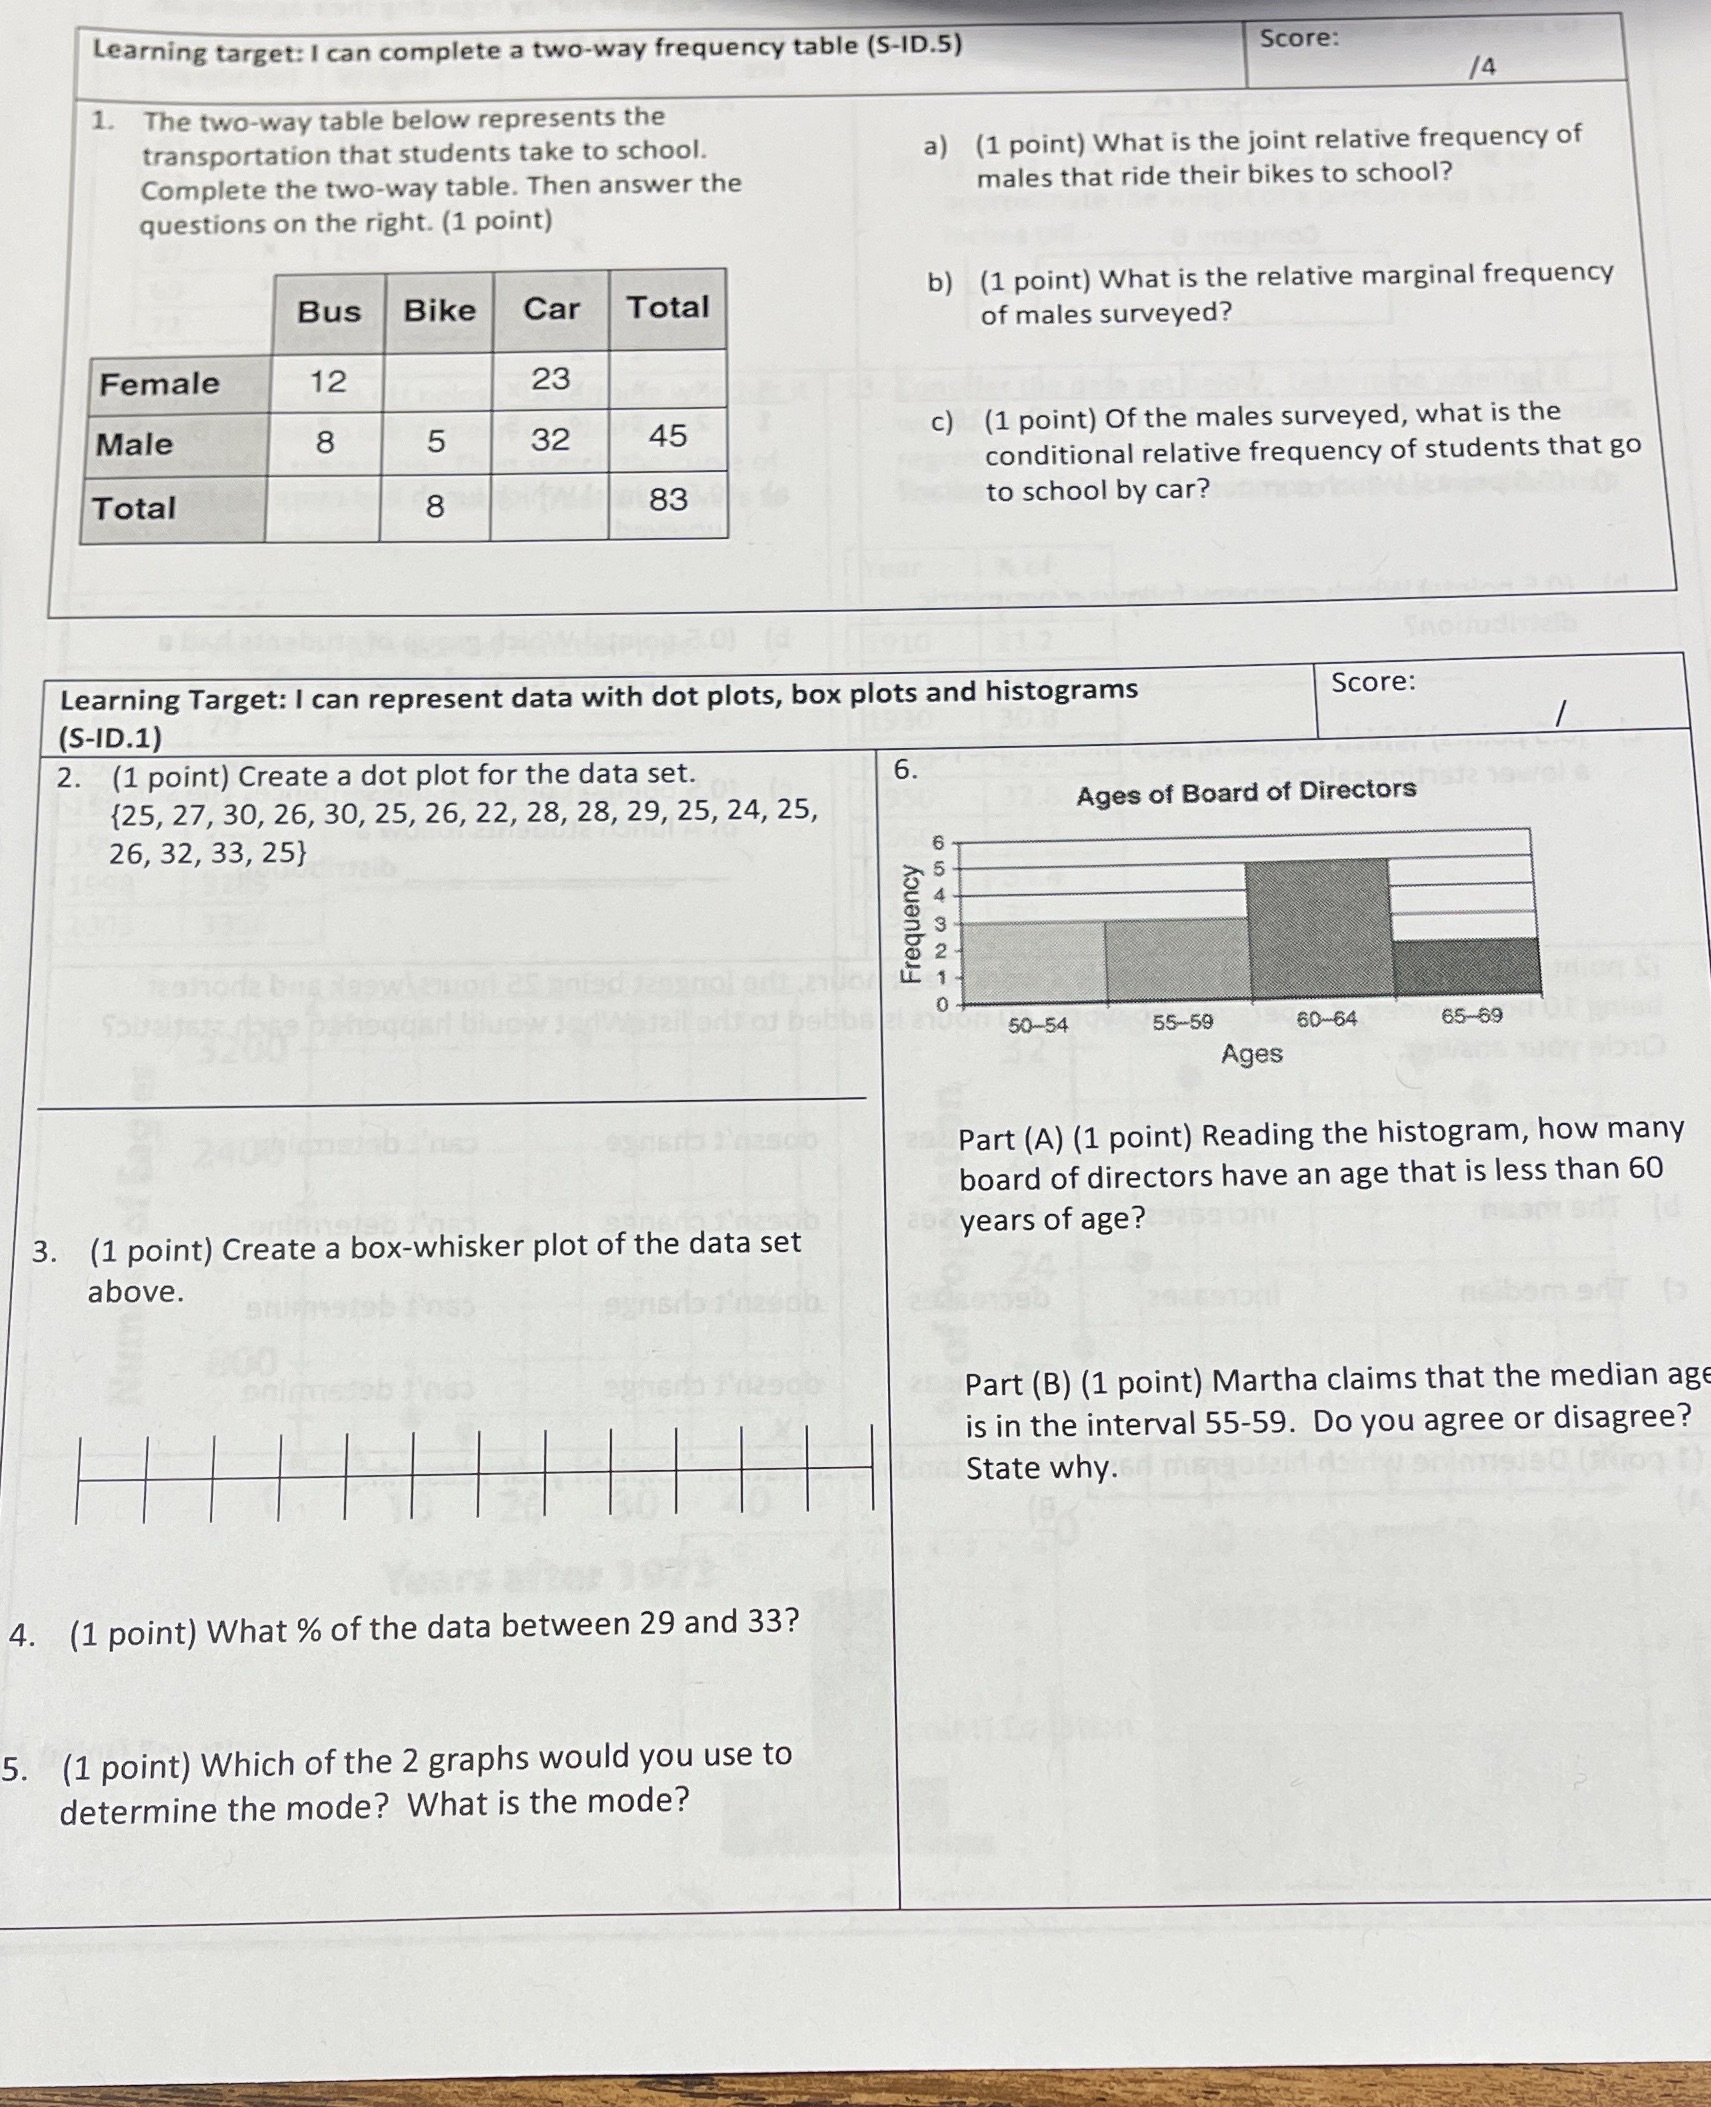
The twoway table below represents the transportation that students take to school. a) (1 point) What is the joint relative frequency of Complete the two-way table. Then answer the males that ride their bikes to school? questions on the right. (1 point) E ' - b) (1 point) What is the relative marginal frequency of males surveyed? c) (1 point) Of the males surveyed, what is the conditional relative frequency of students that go to school by car? 2. (1 point) Create a dot plot for the data set. {25, 27, 30, 25, 30, 25, 26, 22, 28, 28, 29, 25, 24, 25, 26, 32, 33, 25} Ages Part (A) (1 point) Reading the histogram, how many board of directors have an age that is less than 60 years of age? 3. (1 point) Create a box-whisker plot of the data set above. WkknFHHdd-i 4. (1 point) What % of the data between 29 and 33? Part (B) (1 point) Martha claims that the median age is in the interval 55-59. Do you agree or disagree? State why. 5. (1 point) Which of the 2 graphs would you use to determine the mode? What is the mode
Step by Step Solution
There are 3 Steps involved in it

Get step-by-step solutions from verified subject matter experts