

Question: The upper and lower 3-sigma control chart limits are: UCLp LCLp The defect rate for your product has historically been about 1.50%. For a sample
The upper and lower 3-sigma control chart limits are:
UCLp
LCLp
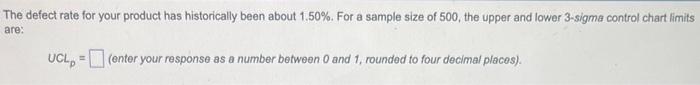
The defect rate for your product has historically been about 1.50%. For a sample size of 500 , the upper and lower 3 -sigma control chart limits are: UCLp=(enteryourresponseasanumberbetween0and1,roundedtofourdecimalplaces).
Step by Step Solution
There are 3 Steps involved in it
1 Expert Approved Answer
Step: 1 Unlock

Question Has Been Solved by an Expert!
Get step-by-step solutions from verified subject matter experts
Step: 2 Unlock
Step: 3 Unlock