

The values in each cell represent the number of orders that contain two items in the same
Question:
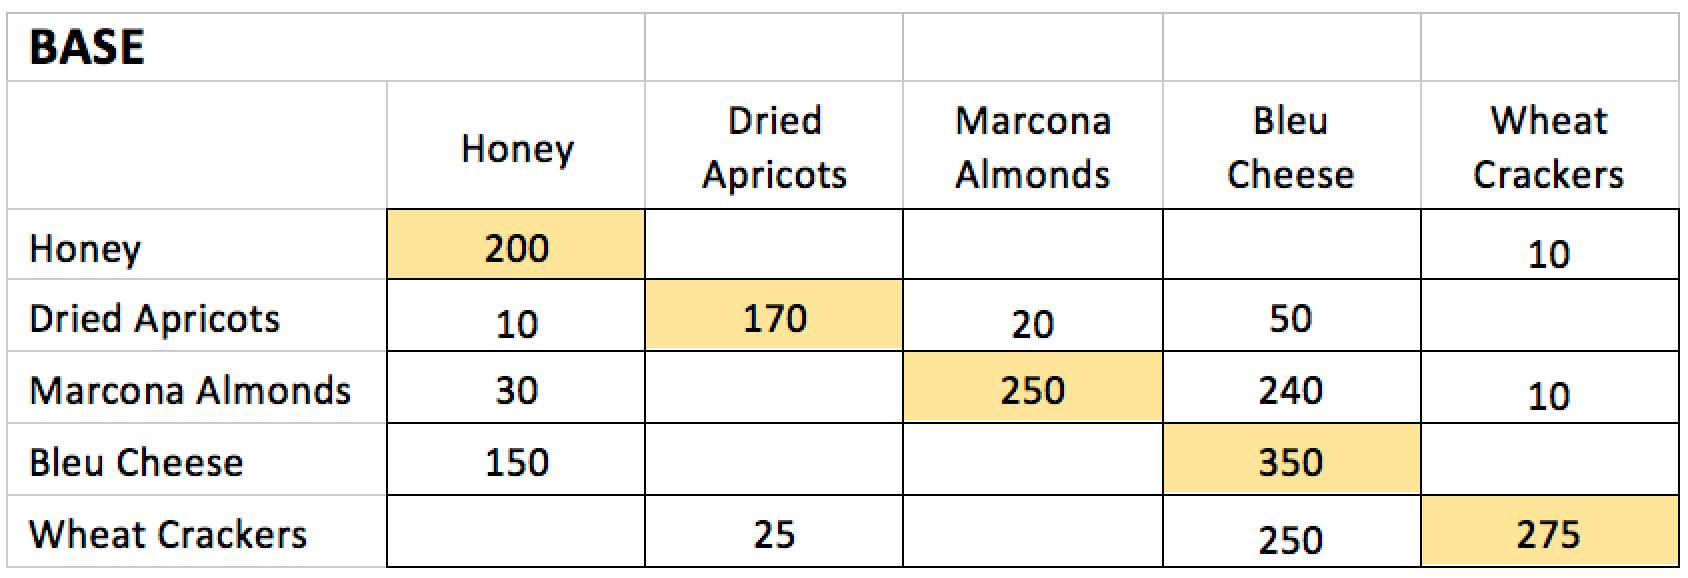
The values in each cell represent the number of orders that contain two items in the same order. For example, the value 30 – found in the cell designated by the 2nd row (Marcona Almonds) and 1st column (Honey) – indicates that there are 30 orders which contain both Marcona Almonds and Honey. Cells on the diagonal (shaded) represent all orders that have a specific item. For example, the value 200 – found in the cell designated by the 1st row and 1st column (Honey) – indicates that 200 of the 400 total orders contain Honey.
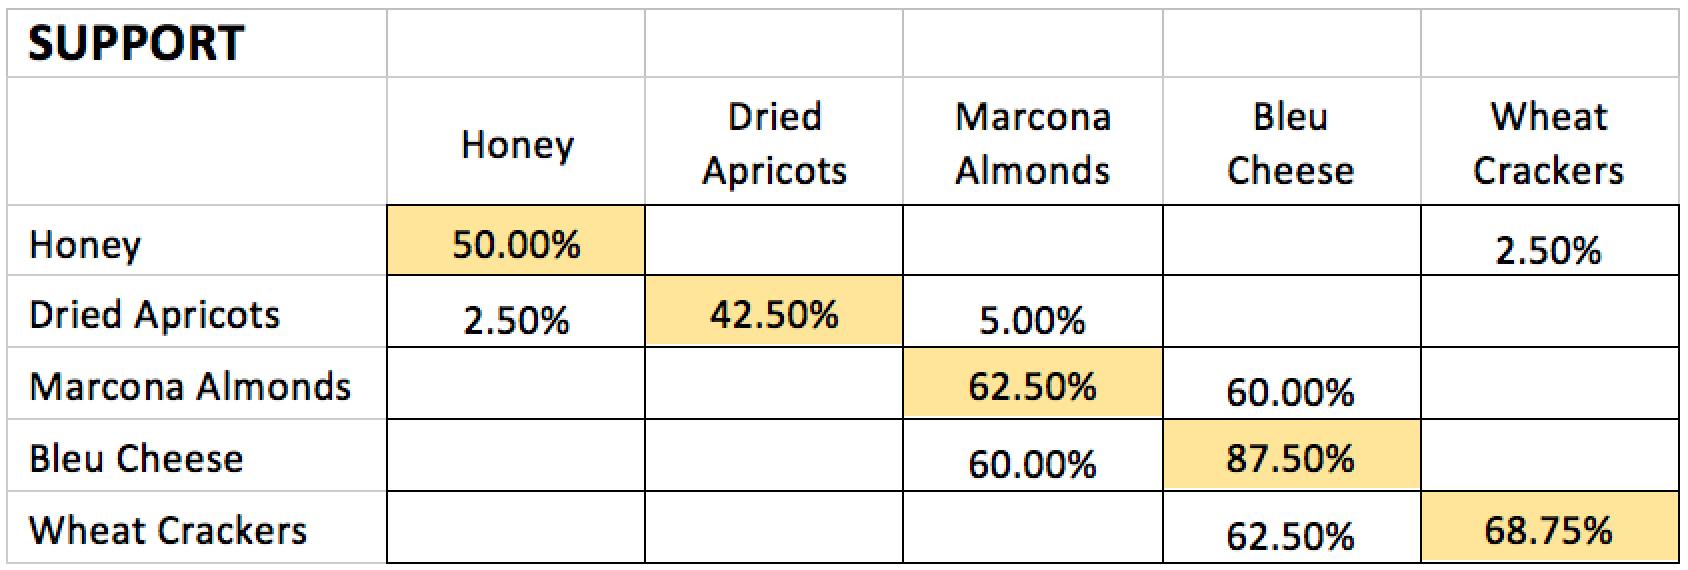
2. Complete the Support Table – The values in this table represent support, which is the percentage of orders that include the items designated at the cross-section. For example, the value 60% -- found in the cell designated by the 4th row (Bleu Cheese) and 3rd column (Marcona Almonds) – indicates that 60% of the orders include both bleu cheese and Marcona almonds.
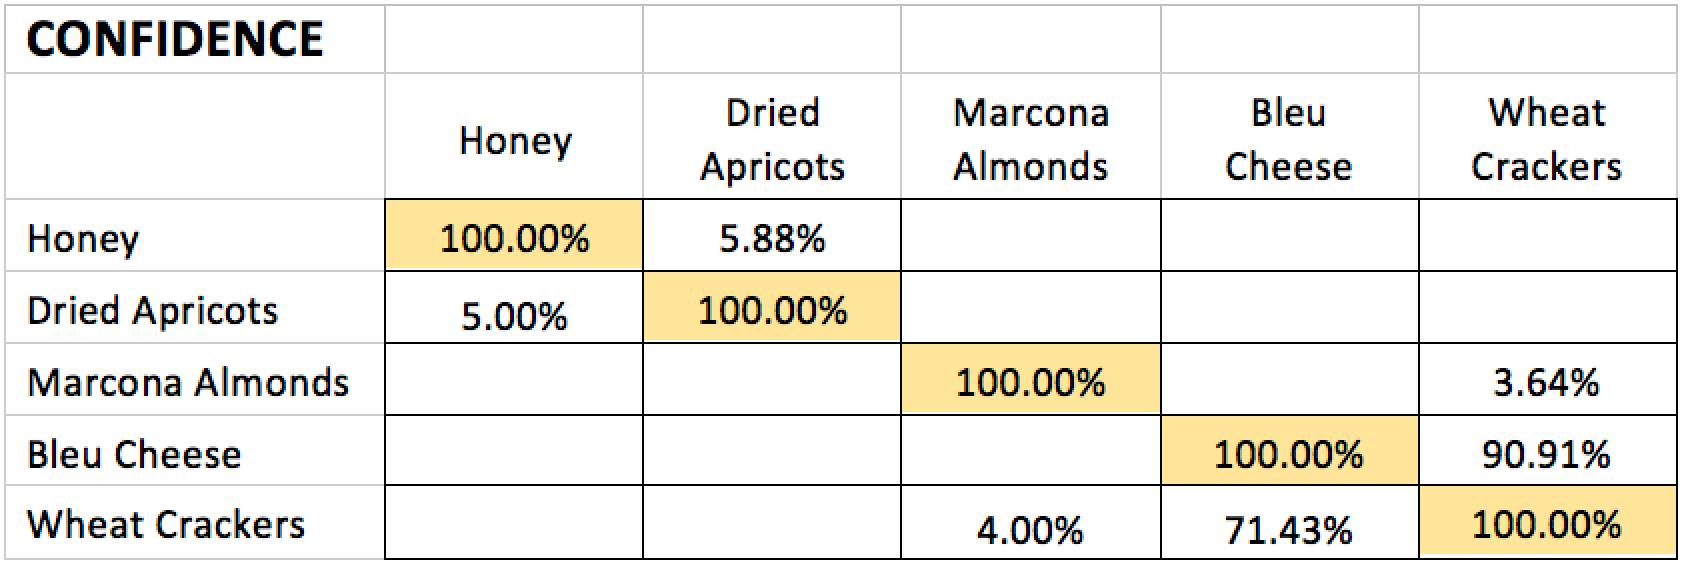
3. Complete the Confidence Table – The values in this table represent confidence, which is the probability that a customer will buy a product, given that s/he has purchased another product. For example, the value 71.43% -- found in the cell designated by the 5throw (Wheat Crackers) and 4th column (Bleu Cheese) – indicates that if a customer orders Bleu Cheese, s/he is 71.43% likely to purchase Wheat Crackers.
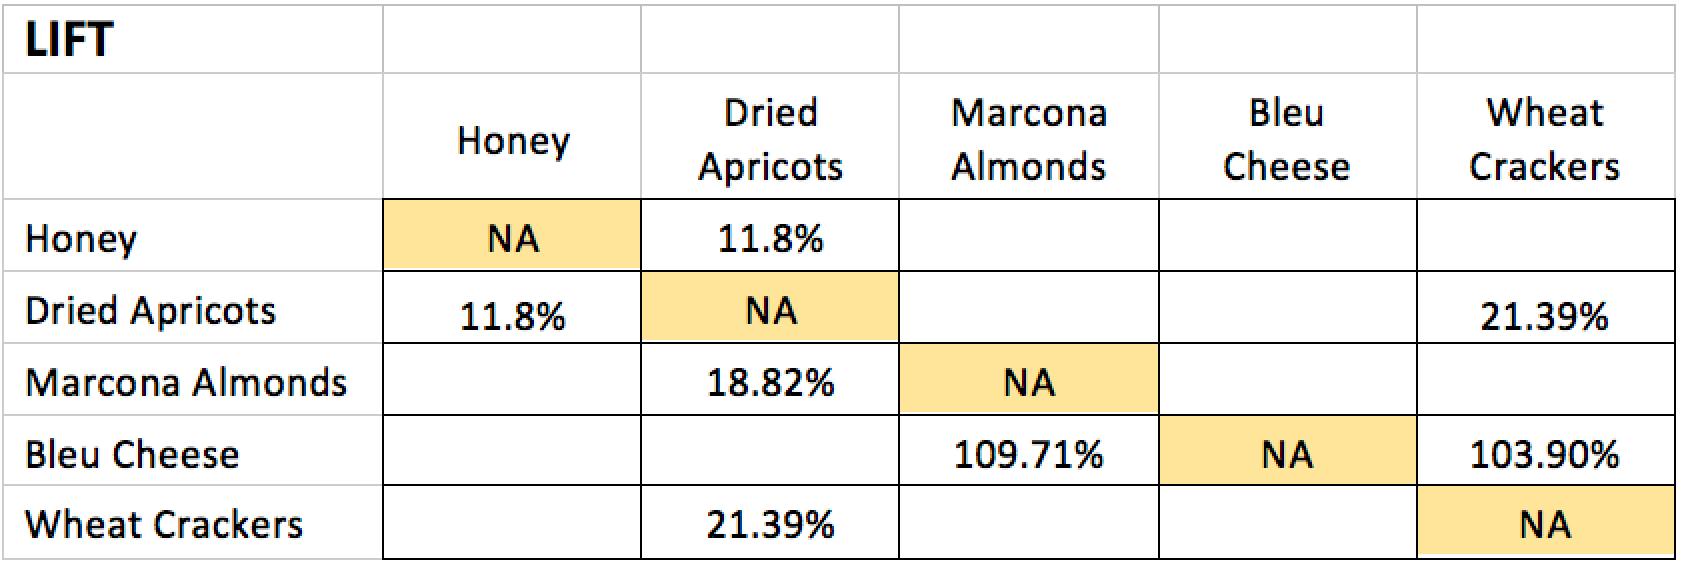
4. Complete the Lift Table – The values in this table represent lift, which quantifies how much the probability of a customer buying a product increases or decreases when s/he purchases another product. For example, the value 109.71% -- found in the cell designated by the 4th row (Bleu Cheese) and 3rd column (Marcona Almonds) – indicates that if a customer buys Marcona Almonds, the probability that s/he will purchase Bleu Cheese increases by 1.0971 times.
Expert Answer:


Business Analytics Data Analysis And Decision Making
ISBN: 9780357109953
7th Edition
Authors: S. Christian Albright, Wayne L. Winston
