

Question: The variable free, measured at the school level, is the percentage of students eligible for the federal free lunch program. The variable medinc is median
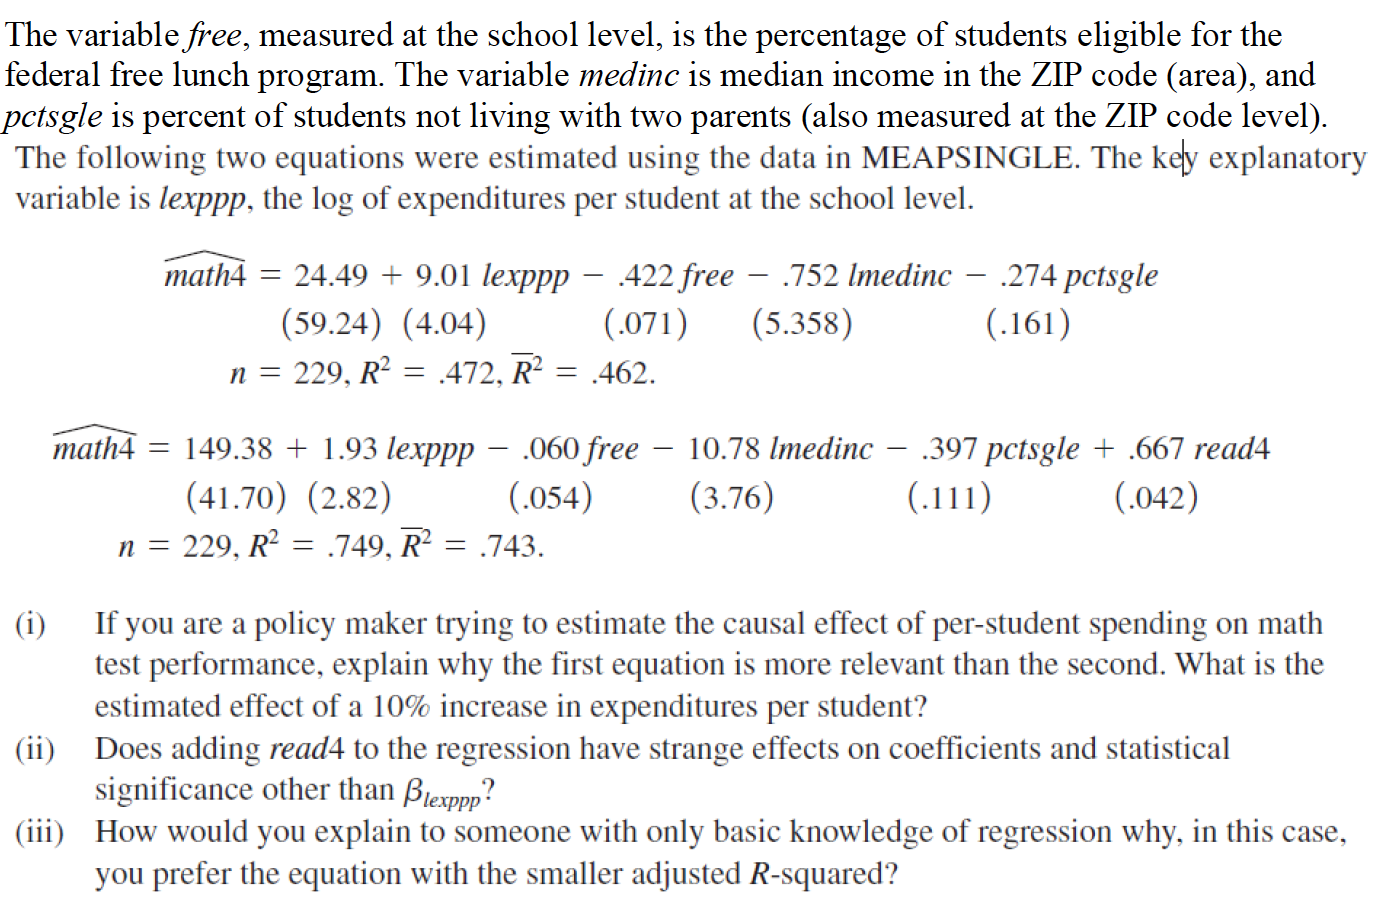
The variable free, measured at the school level, is the percentage of students eligible for the federal free lunch program. The variable medinc is median income in the ZIP code (area), and petsgle is percent of students not living with two parents (also measured at the ZIP code level). The following two equations were estimated using the data in MEAPSINGLE. The key explanatory variable is lexppp, the log of expenditures per student at the school level. math4 = 24.49 + 9.01 lexppp .422 free .752 Imedinc (59.24) (4.04) (.071) (5.358) n = 229, R2 = .472, R2 = .462. .274 pctsgle (.161) = math4 = 149.38 + 1.93 lexppp .060 free (41.70) (2.82) (.054) n = 229, R2 = .749, R2 = .743. 10.78 Imedinc (3.76) .397 petsgle + .667 read4 (.111) (.042) (i) If you are a policy maker trying to estimate the causal effect of per-student spending on math test performance, explain why the first equation is more relevant than the second. What is the estimated effect of a 10% increase in expenditures per student? (ii) Does adding read4 to the regression have strange effects on coefficients and statistical significance other than Plexppp? (iii) How would you explain to someone with only basic knowledge of regression why, in this case, you prefer the equation with the smaller adjusted R-squared? The variable free, measured at the school level, is the percentage of students eligible for the federal free lunch program. The variable medinc is median income in the ZIP code (area), and petsgle is percent of students not living with two parents (also measured at the ZIP code level). The following two equations were estimated using the data in MEAPSINGLE. The key explanatory variable is lexppp, the log of expenditures per student at the school level. math4 = 24.49 + 9.01 lexppp .422 free .752 Imedinc (59.24) (4.04) (.071) (5.358) n = 229, R2 = .472, R2 = .462. .274 pctsgle (.161) = math4 = 149.38 + 1.93 lexppp .060 free (41.70) (2.82) (.054) n = 229, R2 = .749, R2 = .743. 10.78 Imedinc (3.76) .397 petsgle + .667 read4 (.111) (.042) (i) If you are a policy maker trying to estimate the causal effect of per-student spending on math test performance, explain why the first equation is more relevant than the second. What is the estimated effect of a 10% increase in expenditures per student? (ii) Does adding read4 to the regression have strange effects on coefficients and statistical significance other than Plexppp? (iii) How would you explain to someone with only basic knowledge of regression why, in this case, you prefer the equation with the smaller adjusted R-squared
Step by Step Solution
There are 3 Steps involved in it

Get step-by-step solutions from verified subject matter experts