

Question: The voltage measured from a force sensor was saved in the MATLAB workspace he forceSensorata.cat. The le contains two arraysamed and containing the time and
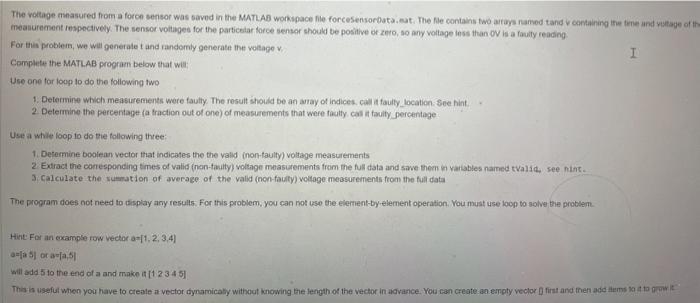
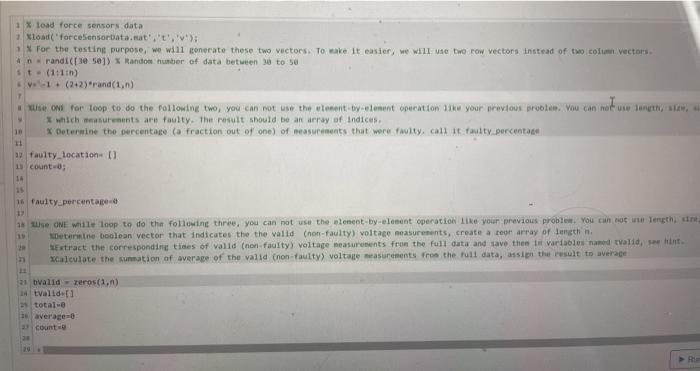
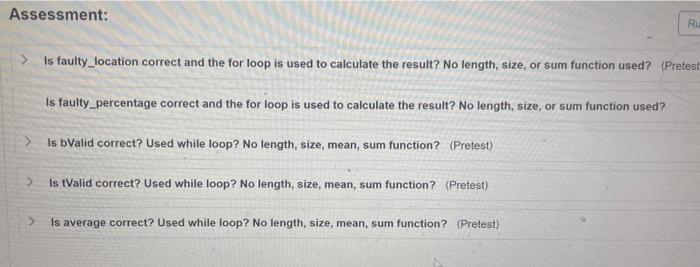
The voltage measured from a force sensor was saved in the MATLAB workspace he forceSensorata.cat. The le contains two arraysamed and containing the time and voltage of the menurement respectively. The sensor voltages for the particular force sensor should be positive of 200, 10 any voltage less than OV is a faulty reading For this problem, we will generate and randomly generate the voltage I Complete the MATLAB program below that will Use one for loop to do the following two 1. Determine which measurements were faulty. The result should be an array of Indices. call it faulty location. See hint 2. Determine the percentage (a fraction out of one of measurements that were fully call it tauity percentage Use a while loop to do the following the 1. Determine boolean vector that indicates the the vald (non-taulty) voltage measurements 2 Extract the corresponding times of valid (non-taulty) voltage measurements from the full data and save them in variables named Valid, see nint 3. Calculate the summation of average of the valid (non faulty) voltage measurements from the full data The program does not need to display any results. For this problem, you can not use the element-by-element operation. You must use koop to solve the problem Hint For an example row vector 11.2.3.4 la 5 ora, will add to the end of a and make it [1 2 3 4 5 This is useful when you have to create a vector dynamically without knowing the length of the vector in advance. You can create an empty vector first and then add terms tad to 1 x Load force sensors data 1 load('forceSensorData.nat't',''); For the testing purpose, we will generate these two vectors to make it easier we will use two row vectors instead of two column vectors *nrandi 3.50]) * Random number of data between 30 to 50 st (111) -1 (2+2) rand (1) we ONE for loop to do the following two you can not use the winnt by element operation at your previous problem. You can not uw length, * which measurements are faulty. The result should be an array of Indices. * Determine the percentage (a fraction out of one of measurements that were foulty, call it aty percenta 11 12 faulty location count 14 1 Faulty percentage. use ONE will loop to do the following three, you can not use the stenent-by-element operation like your previous problem. You can now length Determine boolean vector that indicates the the valid (non-faulty) voltace measurements, create a teor array of length Extract the corresponding times of valid (non faulty) voltage measurements from the full data and save them te variables and valid, hint calculate the summation of average of the valid non faulty) volte masurements from the full data, in the result to average 21 bvalidzeros(1) I valide1 2 totale average count Assessment: Ru > Is faulty location correct and the for loop is used to calculate the result? No length, size, or sum function used? (Pretest Is faulty_percentage correct and the for loop is used to calculate the result? No length, size, or sum function used? > Is bValid correct? Used while loop? No length, size, mean, sum function? (Pretest) > Is tValid correct? Used while loop? No length, size, mean, sum function? (Pretest) > Is average correct? Used while loop? No length, size, mean, sum function? (Pretest) The voltage measured from a force sensor was saved in the MATLAB workspace he forceSensorata.cat. The le contains two arraysamed and containing the time and voltage of the menurement respectively. The sensor voltages for the particular force sensor should be positive of 200, 10 any voltage less than OV is a faulty reading For this problem, we will generate and randomly generate the voltage I Complete the MATLAB program below that will Use one for loop to do the following two 1. Determine which measurements were faulty. The result should be an array of Indices. call it faulty location. See hint 2. Determine the percentage (a fraction out of one of measurements that were fully call it tauity percentage Use a while loop to do the following the 1. Determine boolean vector that indicates the the vald (non-taulty) voltage measurements 2 Extract the corresponding times of valid (non-taulty) voltage measurements from the full data and save them in variables named Valid, see nint 3. Calculate the summation of average of the valid (non faulty) voltage measurements from the full data The program does not need to display any results. For this problem, you can not use the element-by-element operation. You must use koop to solve the problem Hint For an example row vector 11.2.3.4 la 5 ora, will add to the end of a and make it [1 2 3 4 5 This is useful when you have to create a vector dynamically without knowing the length of the vector in advance. You can create an empty vector first and then add terms tad to 1 x Load force sensors data 1 load('forceSensorData.nat't',''); For the testing purpose, we will generate these two vectors to make it easier we will use two row vectors instead of two column vectors *nrandi 3.50]) * Random number of data between 30 to 50 st (111) -1 (2+2) rand (1) we ONE for loop to do the following two you can not use the winnt by element operation at your previous problem. You can not uw length, * which measurements are faulty. The result should be an array of Indices. * Determine the percentage (a fraction out of one of measurements that were foulty, call it aty percenta 11 12 faulty location count 14 1 Faulty percentage. use ONE will loop to do the following three, you can not use the stenent-by-element operation like your previous problem. You can now length Determine boolean vector that indicates the the valid (non-faulty) voltace measurements, create a teor array of length Extract the corresponding times of valid (non faulty) voltage measurements from the full data and save them te variables and valid, hint calculate the summation of average of the valid non faulty) volte masurements from the full data, in the result to average 21 bvalidzeros(1) I valide1 2 totale average count Assessment: Ru > Is faulty location correct and the for loop is used to calculate the result? No length, size, or sum function used? (Pretest Is faulty_percentage correct and the for loop is used to calculate the result? No length, size, or sum function used? > Is bValid correct? Used while loop? No length, size, mean, sum function? (Pretest) > Is tValid correct? Used while loop? No length, size, mean, sum function? (Pretest) > Is average correct? Used while loop? No length, size, mean, sum function? (Pretest)
Step by Step Solution
There are 3 Steps involved in it

Get step-by-step solutions from verified subject matter experts