

Question: The wedding date for a couple is quickly approaching, and the wedding planner must provide the caterer an estimate of how many people will attend
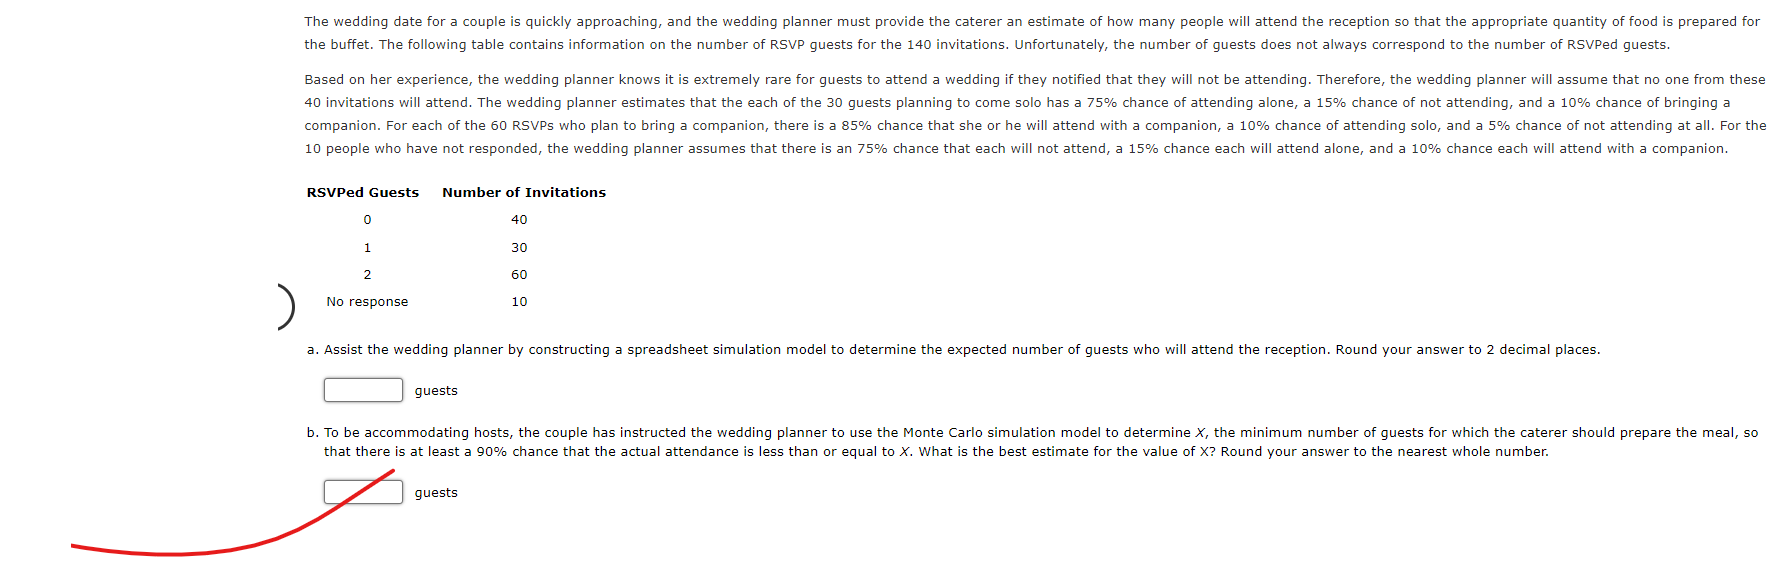
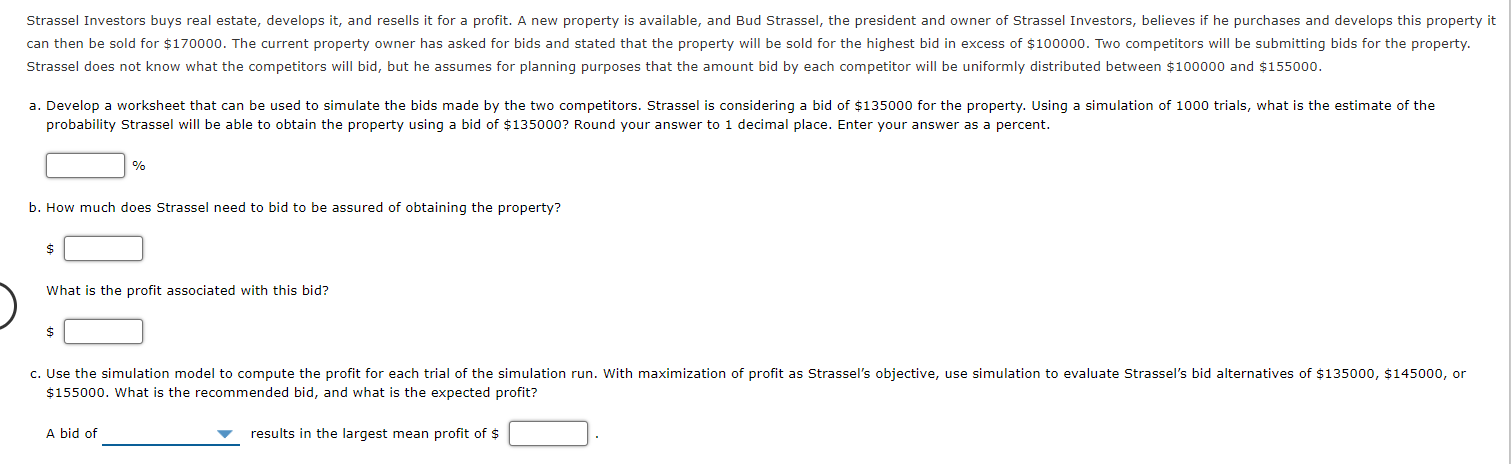
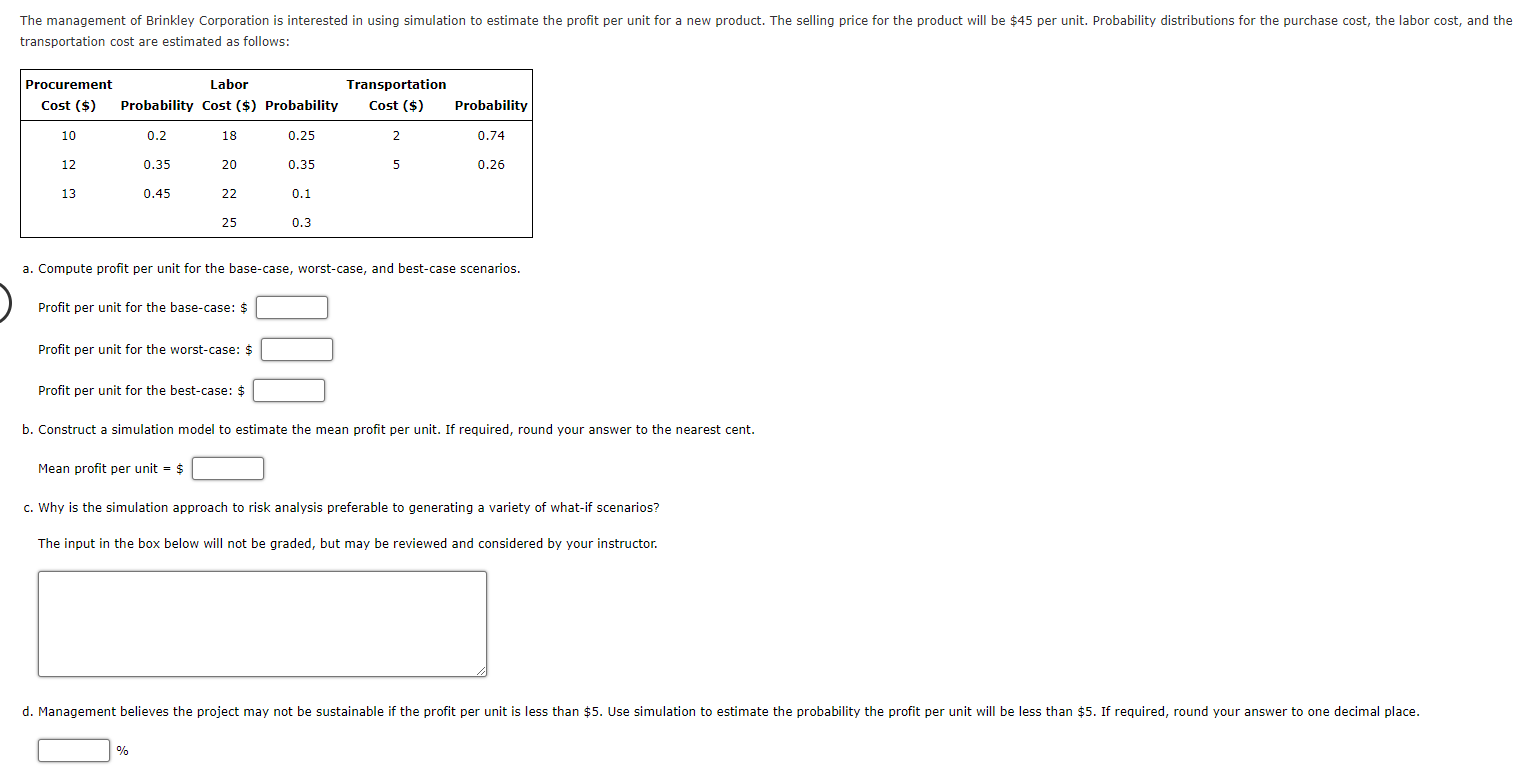
The wedding date for a couple is quickly approaching, and the wedding planner must provide the caterer an estimate of how many people will attend the reception so that the appropriate quantity of food is prepared for the buffet. The following table contains information on the number of RSVP guests for the 140 invitations. Unfortunately, the number of guests does not always correspond to the number of RSVPed guests. Based on her experience, the wedding planner knows it is extremely rare for guests to attend a wedding if they notified that they will not be attending. Therefore, the wedding planner will assume that no one from these 40 invitations will attend. The wedding planner estimates that the each of the 30 guests planning to come solo has a 75% chance of attending alone, a 15% chance of not attending, and a 10% chance of bringing a companion. For each of the 60 RSVPs who plan to bring a companion, there is a 85% chance that she or he will attend with a companion, a 10% chance of attending solo, and a 5% chance of not attending at all. For the 10 people who have not responded, the wedding planner assumes that there is an 75% chance that each will not attend, a 15% chance each will attend alone, and a 10% chance each will attend with a companion. RSVPed Guests Number of Invitations 40 1 30 60 No response 10 a. Assist the wedding planner by constructing a spreadsheet simulation model to determine the expected number of guests who will attend the reception. Round your answer to 2 decimal places. guests b. To be accommodating hosts, the couple has instructed the wedding planner to use the Monte Carlo simulation model to determine X, the minimum number of guests for which the caterer should prepare the meal, so that there is at least a 90% chance that the actual attendance is less than or equal to X. What is the best estimate for the value of X? Round your answer to the nearest whole number. guestsStrassei Investors buys real estate, develops it, and reselis it for a profit. A new property is available, and Bud Strassel, the president and owner of Strassel Investors, beiieves if he purchases and develops this property it can then be sold for $170000. The current propertyI owner has asked for bids and stated that the property will be sold for the highest bid in excess of $100000. Two competitors will be submit-ling bids for the property. Strassei does not know what the competitors will bid, but he assumes For planning purposes that the amount bid by each competitor will be uniformly distributed between $100000 and $155000. a. Develop a worksheet that can be used to simulate the bids made by the two competitors. Strassel is considering a bio of $135000 for the property. Using a simulation of 1000 trials, what is the estimate of the probability Strassel will be able to obtain the property using a bid of $135000? Round your answer to 1 decimal piace. Enter your answer as a percent. i:i % b. How much does Strassel need to bid to be assured of obtaining the property? $ :1 > What is the prot associated with this bid? $ :1 c. Use the simulation model to compute the prot for each trial of the simulation run. with maximization of prot as Strassel's objective, use simulation to evaiuate Strassel's bid alternatives of $135000, $145000, or $155000. What is the recommended bid, and what is the expected profit? A bid of V results in the largest mean prot of $ [:i . The management of Brinkley Corporation is interested in using simulation to estimate the profit per unit for a new product. The selling price for the product will be $45 per unit. Probability distributions for the purchase cost, the labor cost, and the transportation cost are estimated as follows: Procurement Labor Transportation Cost ($) Probability Cost ($) Probability Cost ($) Probability 10 0.2 18 0.25 N 0.74 12 0.35 20 0.35 Un 0.26 13 0.45 22 0.1 25 0.3 a. Compute profit per unit for the base-case, worst-case, and best-case scenarios. Profit per unit for the base-case: $ Profit per unit for the worst-case: $ Profit per unit for the best-case: $ b. Construct a simulation model to estimate the mean profit per unit. If required, round your answer to the nearest cent. Mean profit per unit = $ c. Why is the simulation approach to risk analysis preferable to generating a variety of what-if scenarios? The input in the box below will not be graded, but may be reviewed and considered by your instructor. d. Management believes the project may not be sustainable if the profit per unit is less than $5. Use simulation to estimate the probability the profit per unit will be less than $5. If required, round your answer to one decimal place. %
Step by Step Solution
There are 3 Steps involved in it

Get step-by-step solutions from verified subject matter experts