

Question: The worksheet Hudson Demand Case Data in MindTap provides the number of visits over one year from January to December (52 weeks). Chart the data
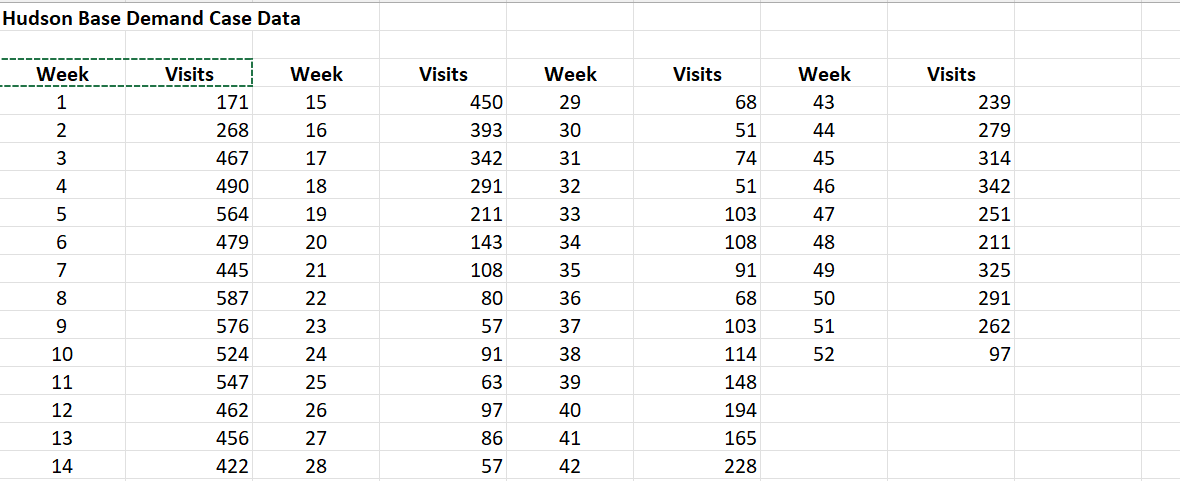
The worksheet Hudson Demand Case Data in MindTap provides the number of visits over one year from January to December (52 weeks). Chart the data in Excel and explain the characteristics of the time series.
How would you forecast future demand for customer visits? What criteria will you use to determine a good forecast? What methods would you use, and why?
What is your final recommendation with respect to a forecasting method?
(Please answer differently then already posted chegg response :) )
Hudson Base Demand Case Data
Step by Step Solution
There are 3 Steps involved in it
1 Expert Approved Answer
Step: 1 Unlock

Question Has Been Solved by an Expert!
Get step-by-step solutions from verified subject matter experts
Step: 2 Unlock
Step: 3 Unlock