

Question: The yields for Treasuries with differing maturities on a recent day were as shown in the following table: a. Select the graph that represents the
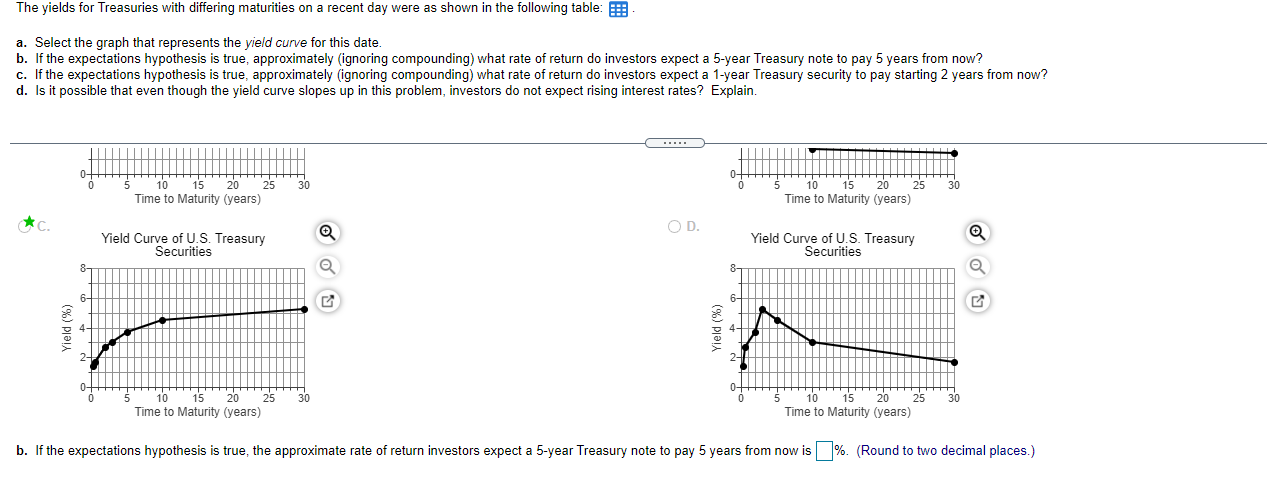
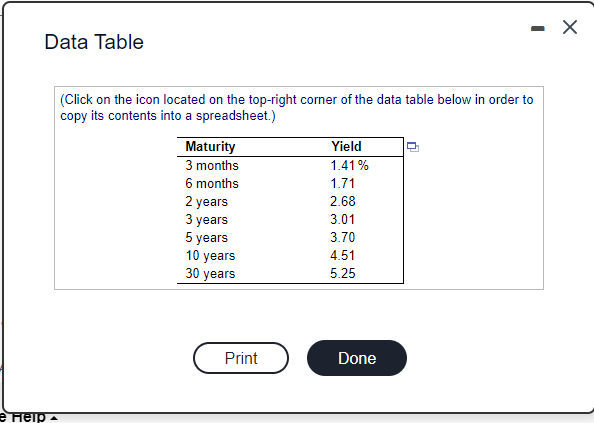
The yields for Treasuries with differing maturities on a recent day were as shown in the following table: a. Select the graph that represents the yield curve for this date. b. If the expectations hypothesis is true, approximately (ignoring compounding) what rate of return do investors expect a 5-year Treasury note to pay 5 years from now? c. If the expectations hypothesis is true, approximately (ignoring compounding) what rate of return do investors expect a 1-year Treasury security to pay starting 2 years from now? d. Is it possible that even though the yield curve slopes up in this problem, investors do not expect rising interest rates? Explain. 10 15 20 25 Time to Maturity (years) 15 20 Time to Maturity (years) * OD. Yield Curve of U.S. Treasury Securities Yield Curve of U.S. Treasury Securities e 30 30 5 10 15 20 25 Time to Maturity (years) 10 15 20 25 Time to Maturity (years) b. If the expectations hypothesis is true, the approximate rate of return investors expect a 5-year Treasury note to pay 5 years from now is %. (Round to two decimal places.) - Data Table (Click on the icon located on the top-right corner of the data table below in order to copy its contents into a spreadsheet.) Maturity Yield 3 months 1.41% 6 months 1.71 2 years 2.68 3 years 3.01 5 years 3.70 10 years 4.51 5.25 30 years Print Done e Help The yields for Treasuries with differing maturities on a recent day were as shown in the following table: a. Select the graph that represents the yield curve for this date. b. If the expectations hypothesis is true, approximately (ignoring compounding) what rate of return do investors expect a 5-year Treasury note to pay 5 years from now? c. If the expectations hypothesis is true, approximately (ignoring compounding) what rate of return do investors expect a 1-year Treasury security to pay starting 2 years from now? d. Is it possible that even though the yield curve slopes up in this problem, investors do not expect rising interest rates? Explain. 10 15 20 25 Time to Maturity (years) 15 20 Time to Maturity (years) * OD. Yield Curve of U.S. Treasury Securities Yield Curve of U.S. Treasury Securities e 30 30 5 10 15 20 25 Time to Maturity (years) 10 15 20 25 Time to Maturity (years) b. If the expectations hypothesis is true, the approximate rate of return investors expect a 5-year Treasury note to pay 5 years from now is %. (Round to two decimal places.) - Data Table (Click on the icon located on the top-right corner of the data table below in order to copy its contents into a spreadsheet.) Maturity Yield 3 months 1.41% 6 months 1.71 2 years 2.68 3 years 3.01 5 years 3.70 10 years 4.51 5.25 30 years Print Done e Help
Step by Step Solution
There are 3 Steps involved in it

Get step-by-step solutions from verified subject matter experts