

Question: The yields for Treasuries with differing maturities on a recent day were as shown in the following table: a. Select the graph that represents the
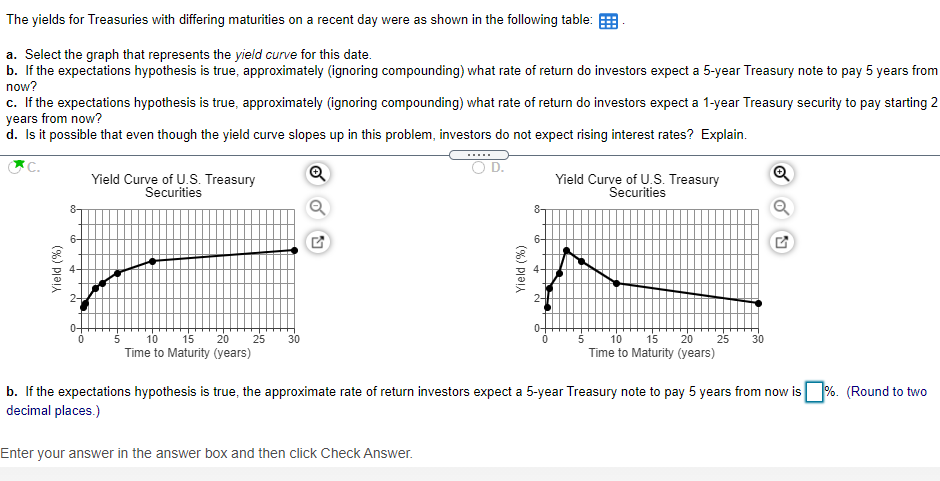
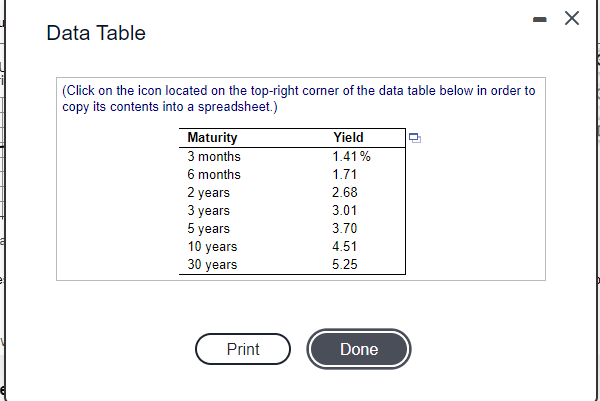
The yields for Treasuries with differing maturities on a recent day were as shown in the following table: a. Select the graph that represents the yield curve for this date. b. If the expectations hypothesis is true, approximately (ignoring compounding) what rate of return do investors expect a 5-year Treasury note to pay 5 years from now? c. If the expectations hypothesis is true, approximately (ignoring compounding) what rate of return do investors expect a 1-year Treasury security to pay starting 2 years from now? d. Is it possible that even though the yield curve slopes up in this problem, investors do not expect rising interest rates? Explain. C. Q OD. Yield Curve of U.S. Treasury Yield Curve of U.S. Treasury Securities Securities 8 8 Yield (%) Yield (%) 0- 20 30 30 10 15 25 Time to Maturity (years) 10 15 20 25 Time to Maturity (years) b. If the expectations hypothesis is true, the approximate rate of return investors expect a 5-year Treasury note to pay 5 years from now is %. (Round to two decimal places.) Enter your answer in the answer box and then click Check Answer. Data Table (Click on the icon located on the top-right corner of the data table below in order to copy its contents into a spreadsheet.) Maturity Yield 3 months 1.41% 6 months 1.71 2 years 2.68 3 years 3.01 5 years 3.70 10 years 4.51 30 years 5.25 Print Done
Step by Step Solution
There are 3 Steps involved in it

Get step-by-step solutions from verified subject matter experts