

Question: Theory-based inference Applet Scenario: | The proportions v Sample Data Options Test of significance Enter data Paste data H, m1 1 2 1 1 Group
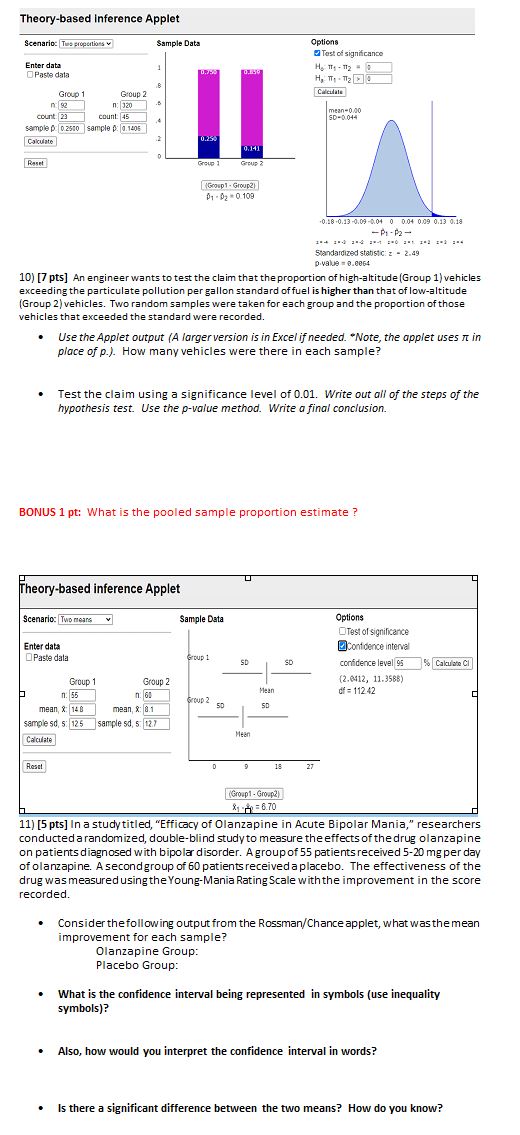

Theory-based inference Applet Scenario: | The proportions v Sample Data Options Test of significance Enter data Paste data H, m1 1 2 1 1 Group 1 Group 2 Calculate 1 92 n: 320 mean-0 00 count |23 count: 45 GD-0 044 sample p |0.2500 | sample : 0.1405 Calculate 0.253 0.141 (Group 1 - Group2) P1 - D2 * 0 109 0.18.0.13-0.09-0.04 0 0.04 0.09 0.13 0.18 - P1 - P2 - Standardized stabst C: z = 2.49 10) [7 pts] An engineer wants to test the claim that the proportion of high-altitude (Group 1) vehicles exceeding the particulate pollution per gallon standard of fuel is higher than that of low-altitude (Group 2) vehicles. Two random samples were taken for each group and the proportion of those vehicles that exceeded the standard were recorded. Use the Applet output (A largerversion is in Excel if needed. "Note, the applet uses it in place of p.). How many vehicles were there in each sample? Test the claim using a significance level of 0.01. Write out all of the steps of the hypothesis test. Use the p-value method. Write a final conclusion. BONUS 1 pt: What is the pooled sample proportion estimate ? Theory-based inference Applet Scenario: Two means Sample Data Options Test of significance Enter data alConfidence interval Paste data SD confidence level 95 5% Calculate CI Group 1 Group 2 (2.0412, 11.3585) Mlean n: 5 n. 6 of = 112 42 Group 2 mean, X: 14 0 mean, x: 8.1 sample sd, 5: 125 sample sd, 5: 127 Mean Calculate Reset D 18 27 (Group1 - Group2] 1 6.70 11) [5 pts] In a study titled, "Efficacy of Olanzapine in Acute Bipolar Mania," researchers conducted a randomized, double-blind study to measure the effects of the drug olanzapine on patients diagnosed with bipolar disorder. A group of 55 patients received 5-20 mg per day of olanzapine. A second group of 60 patients received a placebo. The effectiveness of the drug was measured using the Young-Mania Rating Scale with the improvement in the score recorded. Consider the following output from the Rossman/Chance applet, what was the mean improvement for each sample? Olanzapine Group: Placebo Group: What is the confidence interval being represented in symbols (use inequality symbols)? . Also, how would you interpret the confidence interval in words? . Is there a significant difference between the two means? How do you know
Step by Step Solution
There are 3 Steps involved in it

Get step-by-step solutions from verified subject matter experts