

Question: There are 2 questions to be addressed: 1. How does the density of seeds grown together affect the germination speed, vegetative growth rate, and survival
There are 2 questions to be addressed:
1. How does the density of seeds grown together affect the germination speed, vegetative growth rate, and survival rate of [radish, sunflower, or fenugreek] plants through intraspecific competition?
2. How does the species identity of seeds grown together and allelopathy affect the germination speed, vegetative growth rate, and survival rate of [two chosen plant species] through interspecific competition?
Hypotheses:
Intraspecific -
Null: The density of seeds per growth pellet will not have any impact on the average plant germination speed, average plant vegetative growth rate, and percentage of survival in a single plant species.
Alternative: The density of seeds per growth pellet will have an impact on the average plant germination speed, average plant vegetative growth rate, and percentage of survival in a single plant species.
Interspecific -
Null: The species identity of seeds grown together in the same growth pellet will not have any impact on the average plant germination speed, average plant vegetative growth rate, and percentage of survival in any two plant species.
Alternative: The species identity of seeds grown together in the same growth pellet will have an impact on the average plant germination speed, average plant vegetative growth rate, and percentage of survival in any two plant species.
Link to spreadsheet data: https://docs.google.com/spreadsheets/d/15oFra9lAI2wFgp9n9VBesot_mFMhHZFHp8ijXAu1Ihc/edit?usp=sharing
interspecific: final mean height of plants
| Group number | Pellet 1_Species 1 | Pellet 1_Species 2 | Pellet 2_Species 1 | Pellet 2_Species 2 | Pellet 3_Species 1 | Pellet 3_Species 2 | Pellet 4_Species 1 | Pellet 4_Species 2 | Pellet 5_Species 1 | Pellet 5_Species 2 | Pellet 6_Species 1 | Pellet 6_Species 2 |
| 4 | 0 | 0 | 7.15 cm | 3.5 cm | 3.5 cm | 11.25 cm | 0 | 6.2 cm | 1.9 cm | 1.3 cm | 0 | 6.8cm |
| 5 | 2.3 | 0 | 0 | 3.5 | 0 | 1.79 | 2.24 | 2.29 | 0 | 0.52 | 1.7 | 1.58 |
| 6 | 0 | 100 mm | 0 | 61 mm | 0 | 18 mm | 87 mm | 87 mm | 71 mm | 45 mm | 72 mm | 40.5 mm |
interspecific percentage of surviving seeds
| Group number | Pellet 1_Species 1 | Pellet 1_Species 2 | Pellet 2_Species 1 | Pellet 2_Species 2 | Pellet 3_Species 1 | Pellet 3_Species 2 | Pellet 4_Species 1 | Pellet 4_Species 2 | Pellet 5_Species 1 | Pellet 5_Species 2 | Pellet 6_Species 1 | Pellet 6_Species 2 |
| 4 | 0% | 0% | 100% | 100% | 100% | 100% | 50% | 100% | 100% | 100% | 0% | 100% |
| 5 | 100% | 0% | 0% | 100% | 0% | 50% | 50% | 100% | 0% | 33.30% | 66.70% | 33.30% |
| 6 | 0% | 100% | 0% | 100% | 0% | 50% | 50% | 50% | 33% | 33% | 33% | 66% |
interspecific mean number of days to germinate
| Group number | Pellet 1_Species 1 | Pellet 1_Species 2 | Pellet 2_Species 1 | Pellet 2_Species 2 | Pellet 3_Species 1 | Pellet 3_Species 2 | Pellet 4_Species 1 | Pellet 4_Species 2 | Pellet 5_Species 1 | Pellet 5_Species 2 | Pellet 6_Species 1 | Pellet 6_Species 2 |
| 4 | 0 | 0 | 4 | 11 | 2 | 4.5 | 2 | 2 | 1.3 | 3 | 0 | 5.3 |
| 5 | 4 | 0 | 0 | 4 | 0 | 2 | 2 | 10.5 | 0 | 4.667 | 6 | 4.33 |
| 6 | 0 | 4 | 0 | 2 | 0 | 8 | 2 | 3 | 2 | 6.5 | 3 | 6 |
intraspecific: final mean height of plants
| Group number | Pellet 1 | Pellet 2 | Pellet 3 | Pellet 4 | Pellet 5 | Pellet 6 |
| 1 | 0mm | 0mm | 0mm | 0mm | 0mm | 2.5mm |
| 2 | 0mm | 0mm | 0mm | 6mm | 0mm | 3.5mm |
| 3 | 0mm | 1.15 mm | 2.8 mm | 0mm | 6mm | 1.2 mm |
intraspecific mean number of days to germinate
| Group number | Pellet 1 | Pellet 2 | Pellet 3 | Pellet 4 | Pellet 5 | Pellet 6 |
| 1 | 0 | 0 | 0 | 0 | 0 | 10 |
| 2 | 0 | 0 | 0 | 1 | 0 | 3 |
| 3 | 0 | 7 | 2 | 0 | 1 | 6 |
intraspecific percentage of surviving seeds
| Group number | Pellet 1 | Pellet 2 | Pellet 3 | Pellet 4 | Pellet 5 | Pellet 6 |
| 1 | 0% | 0% | 0% | 0% | 0% | 0% |
| 2 | 0% | 0% | 0% | 25% | 0% | 16.70% |
| 3 | 0% | 50% | 0% | 0% | 16.70% | 16.70% |
using the questions along with the hypotheses written above, please do t-test and explain what the results mean in terms of the null and alternative hypotheses. I really need the T-TEST values please because I'm very confused!! Thank you!
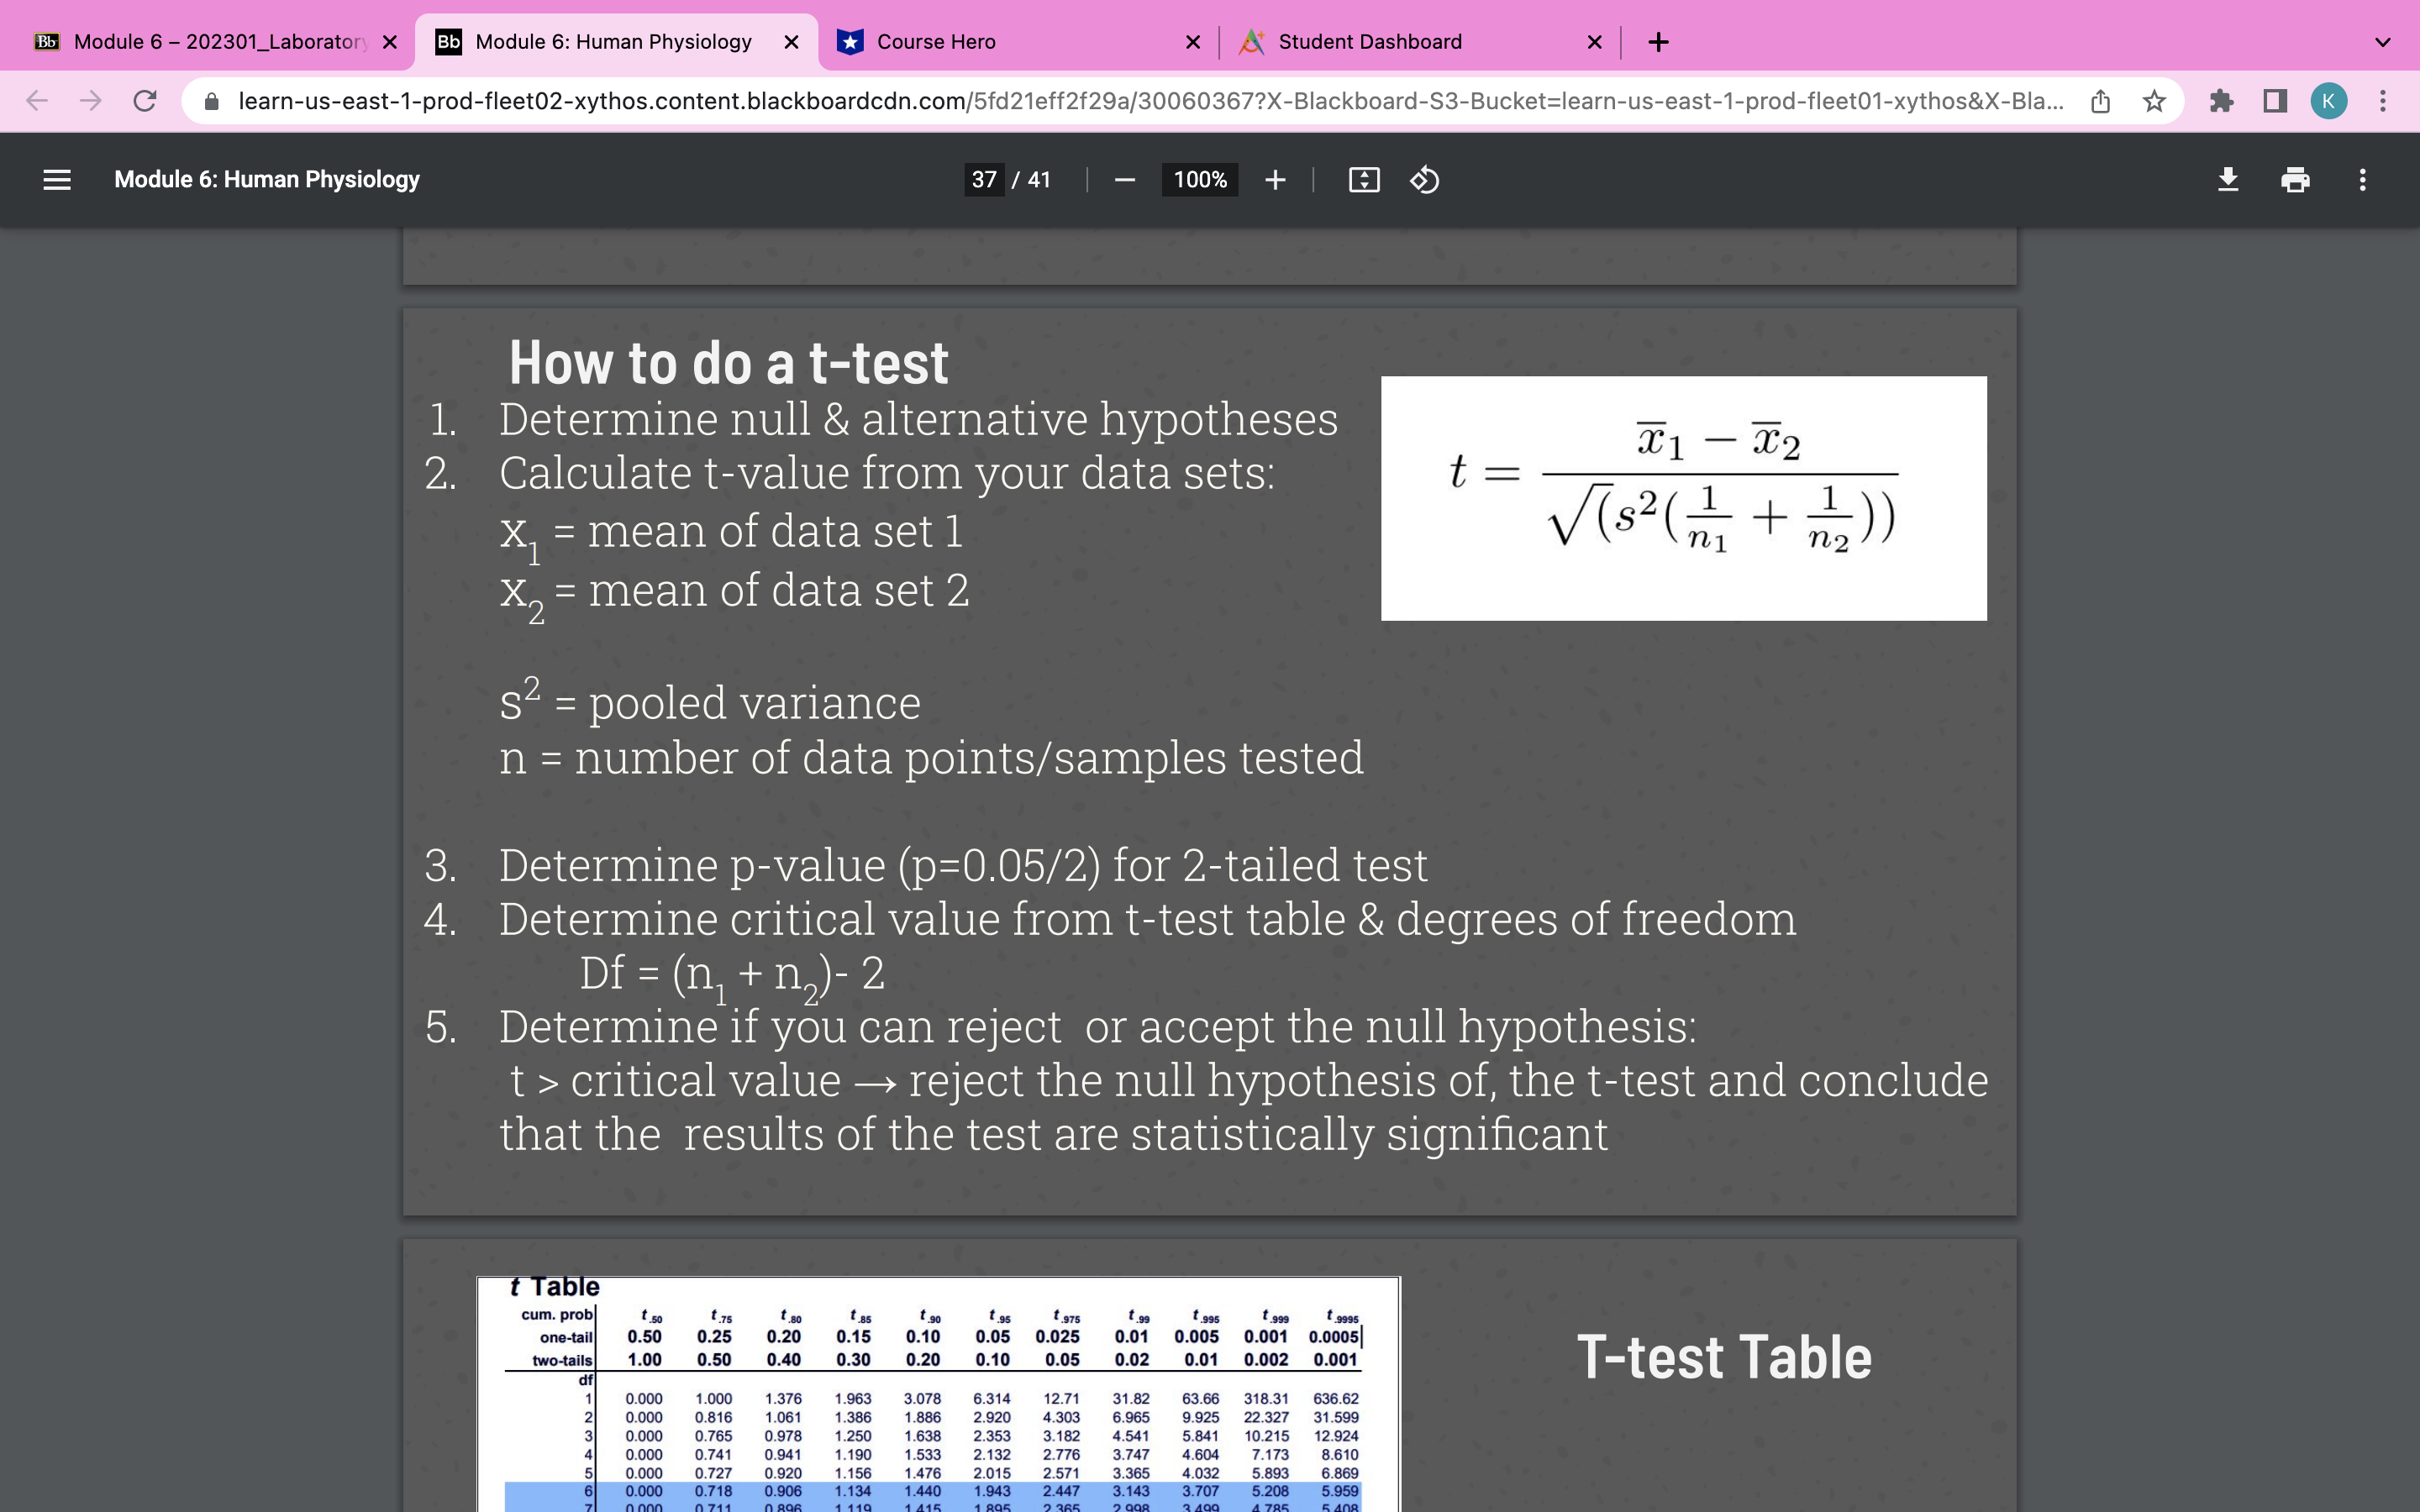
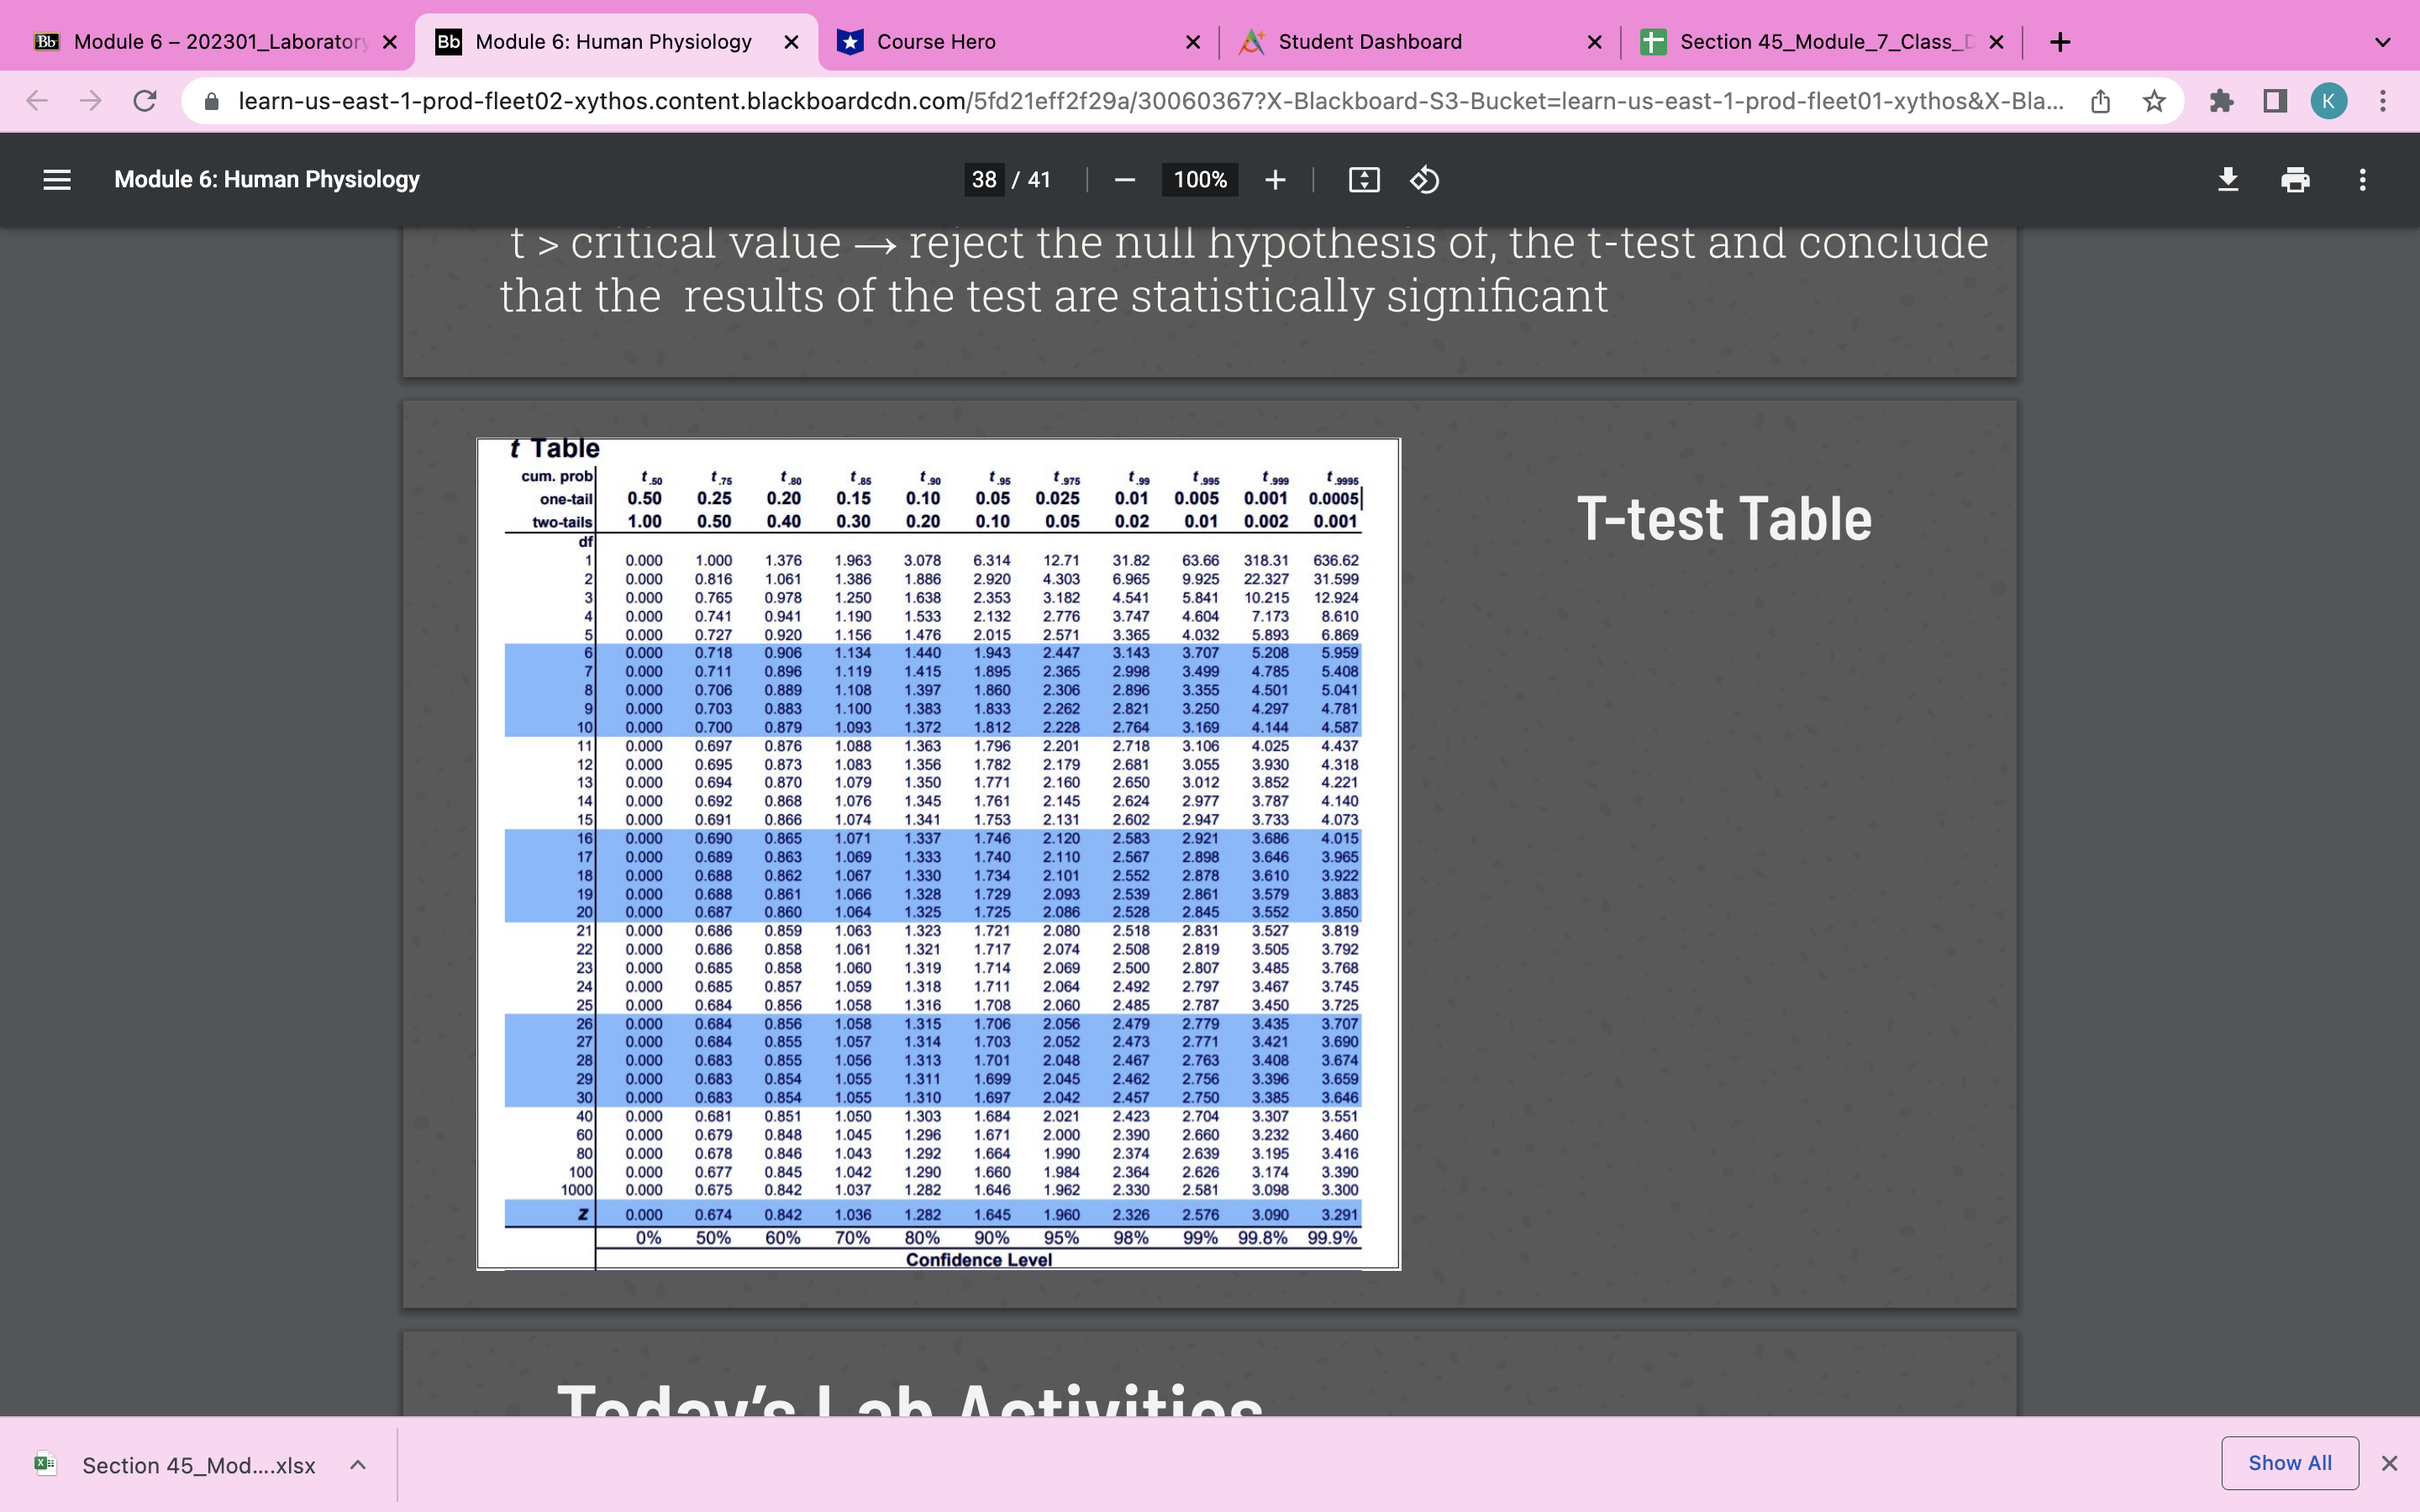
How to do a t-test Determine null & alternative hypotheses Calculate tvalue from your data sets: X1 = mean of data set 1 X2 = mean of data set 2 82 = pooled variance n = number of data points/ samples tested Determine pvalue (p=0.05/2) for 2tailed test Determine critical value from ttest table & degrees of freedom Df= (n1+ n2) 2 Determine if you can reject or accept the null hypothesis: t > critical value > reject the null hypothesis of, the t-test and conclude that the results of the test are statistically significant T-test Table x Student Dashboard x + Section 45_Module_7_Class_D X + Course Hero Bb Module 6 - 202301_Laboratory X Bb Module 6: Human Physiology X a learn-us-east-1-prod-fleet02-xythos.content.blackboardcdn.com/5fd21eff2f29a/30060367?X-Blackboard-$3-Bucket=learn-us-east-1-prod-fleet01-xythos&X-Bla... 100% + Module 6: Human Physiology 38 / 41 t > critical value - reject the null hypothesis of, the t-test and conclude that the results of the test are statistically significant t Table t.so .80 t.95 t .975 t.995 cum. prob 0.005 0.001 0.0005 one-tail 0.50 0.25 0.20 0.15 0.10 0.05 0.025 0.01 0.30 0.20 0.10 0.05 0.02 0.01 0.002 0.001 two-tails 0.50 0.40 T-test Table 1.00 636.62 0.000 1.00 1.376 1.963 3.078 6.314 12.71 31.82 63.66 318.31 6.965 22.327 31.599 0.000 0.816 1.061 1.386 1.886 2.920 4.303 1.638 2.353 3.18 4.541 5.841 10.215 12.924 0.000 0.765 0.978 1.250 3.747 4.604 7.173 8.610 0.000 0.741 0.941 1.190 1.533 2.132 0.000 0.727 0.920 1.156 1.47 2.015 2.571 3.365 4.032 5.893 6.869 5.208 5.959 0.000 0.718 0.906 1.134 1.44 1.943 2.447 3.143 3.707 3.499 4.785 5.408 0.000 0.711 0.896 1.119 1.415 1.895 2.365 2.998 4.501 5.041 0.000 0.706 0.889 1.108 1.397 2.306 2.89 3.355 0.000 0.703 0.883 1.10 1.383 1.833 2.26 2.821 3.250 4.297 4.781 0.700 0.879 1.093 1.372 1.812 2.228 2.764 3.169 4.144 4.587 0.000 4.025 4.437 0.000 0.697 0.876 1.088 1.363 1.796 2.201 2.718 3.106 4.318 0.000 0.695 0.873 1.083 1.356 1.782 2.17 2.68 3.055 3.930 2.160 2.650 3.012 3.852 4.221 0.000 0.694 0.870 1.079 1.350 1.771 2.14 2.977 3.787 4.140 0.000 0.692 0.868 1.076 1.345 1.761 2.624 2 60 2.947 3.733 4.073 0.000 0.691 0.866 1.074 1.341 1.753 2.13 4.015 0.000 0.690 0.865 1.071 1.337 1.746 2.120 2.583 2.921 3.686 1.333 1.740 2.11 2.567 2.898 3.646 3.965 0.000 0.689 0.863 1.069 0.688 0.862 1.067 1.330 1.734 2.101 2.552 2.878 3.610 3.922 0.000 2539 2.861 3.883 0.000 0.688 0.861 1.066 1.729 2.093 3.579 1.064 1.325 1.725 2.08 2.528 2.845 3.552 0.000 0.687 0.860 2.518 2.831 3.527 3.819 0.000 0.686 0.85 1.063 1.323 1.721 2.080 0.85 1.061 1.321 1.717 2.074 2.508 2.819 3.505 3.792 0.000 0.686 1.319 1.714 2.06 2.50 2.807 3.48 3,768 0.000 0.685 0.858 1.060 1.318 1.711 2.06 2 492 2.797 3.46 3.745 0.000 0.685 0.857 1.059 2485 3.450 3.725 0.000 0.684 0.856 1.058 1.316 1.708 2.060 2.787 1.315 2.056 2.479 2.779 3.435 3.707 0.000 0.684 0.856 1.058 1.706 0.684 0.85 1.057 1.314 1.703 2.05 2.473 2.771 3.421 3.690 0.000 0.855 1.313 1.701 2.048 2.467 2.763 3.408 3.674 0.000 0.683 1.056 1.311 2.04 2.462 2.756 3.396 0.000 0.683 0.854 1.055 0.854 1.055 1.310 1.697 2.042 2.457 2.750 3.385 3.646 0.000 0.683 0.000 0.681 1.303 2.021 2.423 2.704 3.307 0.851 1.050 1.671 2.000 2.390 2.660 3.232 3.460 0.000 0.679 0.848 1.045 1.296 0.678 1.043 1.292 1.664 2.374 2.639 3.195 3.416 0.000 0.846 1.990 2.364 2.626 3.174 3.390 0.000 0.677 0.845 1.042 3.300 1000 0.000 0.675 0.842 1.037 1.282 1.646 1.962 2.330 2.581 3.098 Z 0.000 0.674 0.842 1.036 1.282 1.645 1.960 2.326 2.576 3.090 3.291 0% 50% 60% 70% 80% 95% 98% 99% 99.8% 99.9% Confidence Level Today's Lab Activition Show All X Section 45_Mod....xIsx
Step by Step Solution
There are 3 Steps involved in it

Get step-by-step solutions from verified subject matter experts