

Question: There are 2 tables shown below. The first table reports the mean returns and standard deviation in returns to stocks in the US , UK
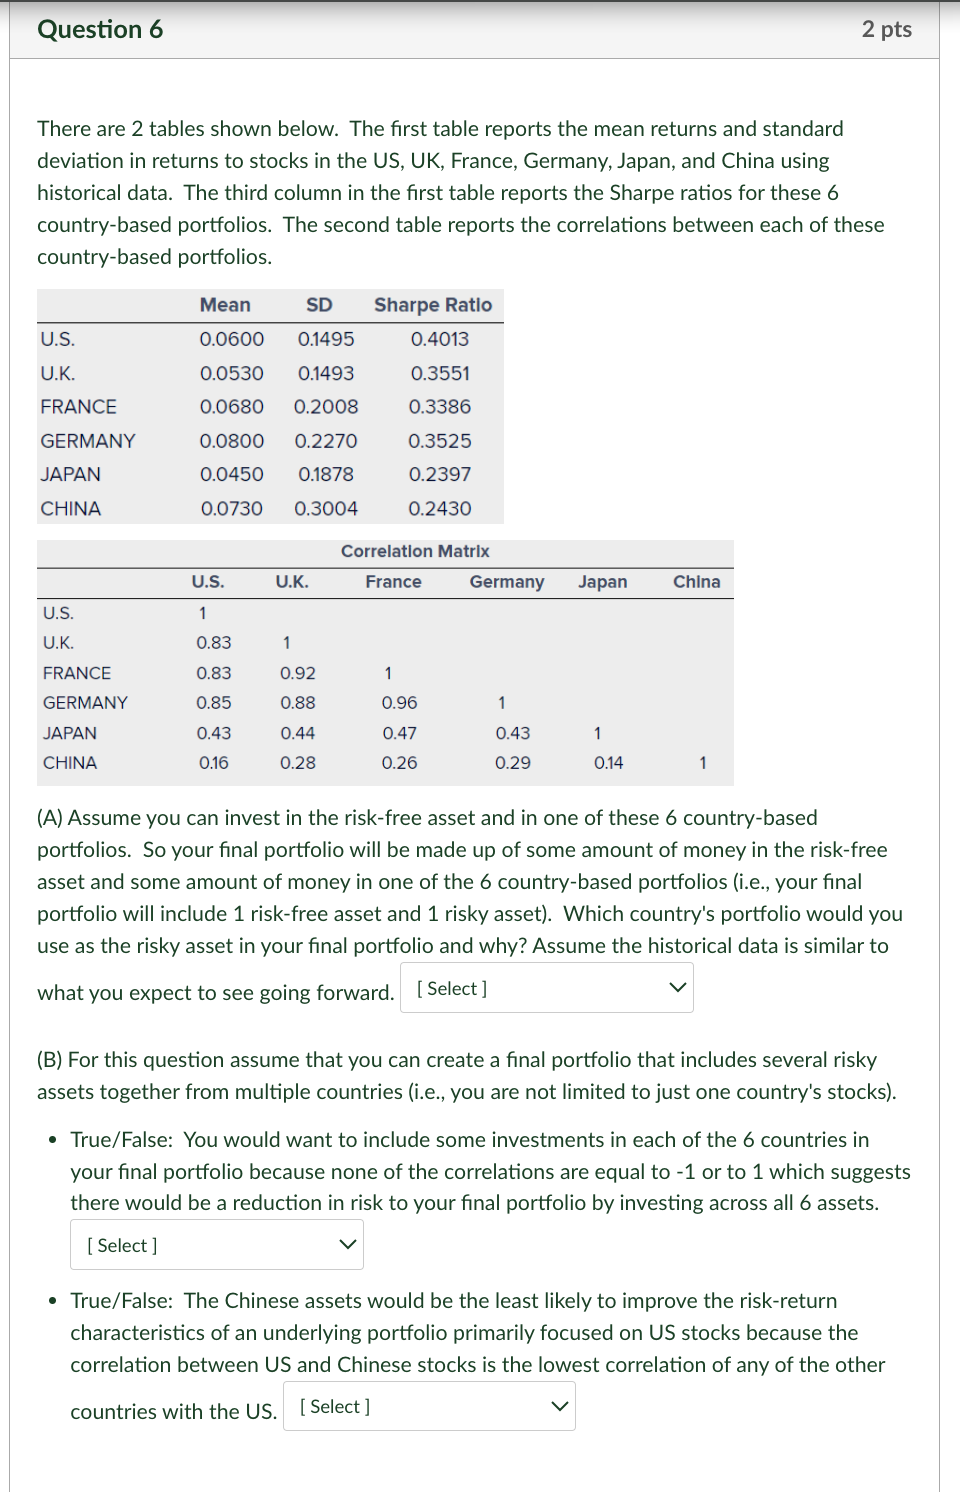
There are tables shown below. The first table reports the mean returns and standard deviation in returns to stocks in the US UK France, Germany, Japan, and China using historical data. The third column in the first table reports the Sharpe ratios for these countrybased portfolios. The second table reports the correlations between each of these countrybased portfolios. A Assume you can invest in the riskfree asset and in one of these countrybased portfolios. So your final portfolio will be made up of some amount of money in the riskfree asset and some amount of money in one of the countrybased portfolios ie your final portfolio will include riskfree asset and risky asset Which country's portfolio would you use as the risky asset in your final portfolio and why? Assume the historical data is similar to what you expect to see going forward. B For this question assume that you can create a final portfolio that includes several risky assets together from multiple countries ie you are not limited to just one country's stocks TrueFalse: You would want to include some investments in each of the countries in your final portfolio because none of the correlations are equal to or to which suggests there would be a reduction in risk to your final portfolio by investing across all assets. TrueFalse: The Chinese assets would be the least likely to improve the riskreturn characteristics of an underlying portfolio primarily focused on US stocks because the correlation between US and Chinese stocks is the lowest correlation of any of the other countries with the US
Step by Step Solution
There are 3 Steps involved in it
1 Expert Approved Answer
Step: 1 Unlock

Question Has Been Solved by an Expert!
Get step-by-step solutions from verified subject matter experts
Step: 2 Unlock
Step: 3 Unlock