

Question: there are 3 questions please answer all : for the first just solve letter d all the rest is done. and then second and third
there are 3 questions please answer all : for the first just solve letter d all the rest is done. and then second and third picture. 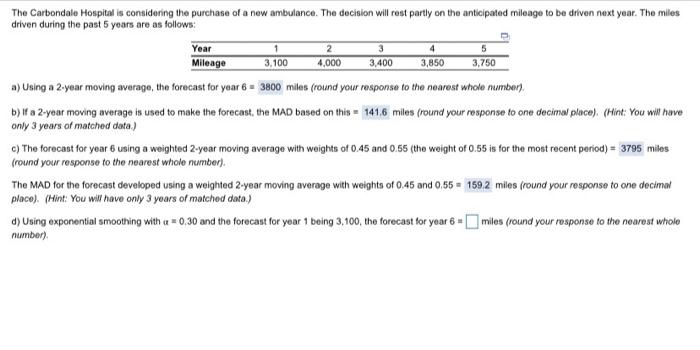
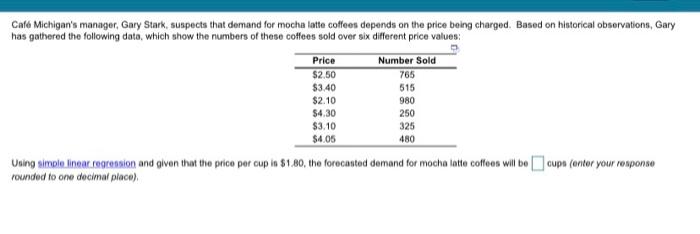
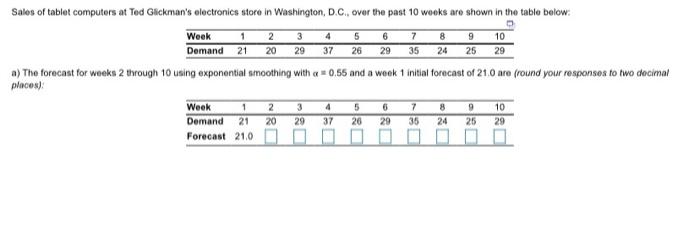
4 3,850 The Carbondale Hospital is considering the purchase of a new ambulance. The decision will rest partly on the anticipated mileage to be driven next year. The miles driven during the past 5 years are as follows: Year 1 2 3 5 Mileage 3.100 4,000 3,400 3,750 a) Using a 2-year moving average, the forecast for year 6 - 3800 miles (round your response to the nearest whole number). b) If a 2-year moving average is used to make the forecast, the MAD based on this = 141,6 miles (round your response to one decimal place). (Hint: You will have only 3 years of matched data) c) The forecast for year 6 using a weighted 2-year moving average with weights of 0.45 and 0.55 (the weight of 0.55 is for the most recent period) = 3795 miles (round your response to the nearest whole number). The MAD for the forecast developed using a weighted 2-year moving average with weights of 0.45 and 0.55 159.2 miles (round your response to one decimal place). (Hint: You will have only 3 years of matched dats.) d) Using exponential smoothing with a = 0,30 and the forecast for year 1 being 3, 100, the forecast for year 6 = miles (round your rosponse to the nearest whole number) Caf Michigan's manager, Gary Stark, suspects that demand for mocha latte coffees depends on the price being charged. Based on historical observations, Gary has gathered the following data, which show the numbers of these coffees sold over six different price values: Price Number Sold $2.50 765 $3.40 515 $2.10 980 $4.30 $3.10 325 $4.05 480 Using simple linear regression and given that the price per cup in $1.80, the forecasted demand for mocha latte coffees will be cupa (ontor your response rounded to one decimal place) 250 5 Sales of tablet computers at Ted Glickman's electronics store in Washington, DCover the past 10 weeks are shown in the table below: Week 1 2 3 4 8 9 10 Demand 21 20 29 37 26 29 35 24 25 29 a) The forecast for weeks 2 through 10 using exponential smoothing with a = 0,55 and a wosk 1 initial forecast of 21.0 are fround your responses to two decimal places) Week Demand 21 20 26 29 35 24 25 29 Forecast 210 1 5 6 7 10 3 29 4 37
Step by Step Solution
There are 3 Steps involved in it
1 Expert Approved Answer
Step: 1 Unlock

Question Has Been Solved by an Expert!
Get step-by-step solutions from verified subject matter experts
Step: 2 Unlock
Step: 3 Unlock