

Question: There are different methods of checking data normality like PP-plot, histogram, normality tests and skewness and kurtosis. Following is the SPSS result of checking data
There are different methods of checking data normality like PP-plot, histogram, normality tests and skewness and kurtosis. Following is the SPSS result of checking data normality through skewness and kurtosis.
Requirement: You are supposed to interpret each variable's values of skewness and kurtosis to conclude whether each variable is normally distributed or non-normally distributed. After conclusion of data normality, you are supposed to mention whether you will apply parametric test or non-parametric test. Variables are given in the table below with their values.
Table in Attachment
D
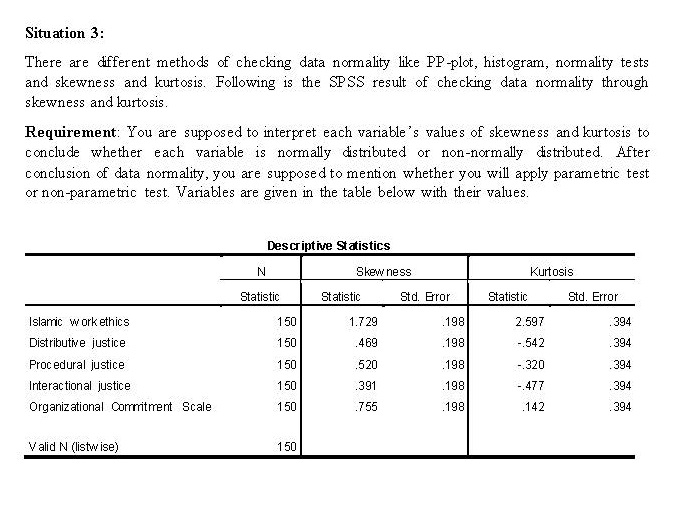
Situation 3: There are different methods of checking data normality like PP-plot, histogram, normality tests and skewness and kurtosis. Following is the SPSS result of checking data normality through skewness and kurtosis. Requirement: You are supposed to interpret each variable's values of skewness and kurtosis to conclude whether each variable is normally distributed or non-normally distributed. After conclusion of data normality, you are supposed to mention whether you will apply parametric test of non-parametric test. Variables are given in the table below with their values. Descriptive Statistics N Skew ness Kurtosis Statistic Statistic Std. Bror Statistic Std. Error Islamic work ethics 150 1.729 .198 2.597 394 Distributive justice 150 .469 .198 -.542 394 Procedural justice 150 520 .198 -.320 394 Interactional justice 150 .391 .198 -.477 394 Organizational Commitment Scale 150 .755 .198 142 394 Valid N (listwise) 150
Step by Step Solution
There are 3 Steps involved in it

Get step-by-step solutions from verified subject matter experts