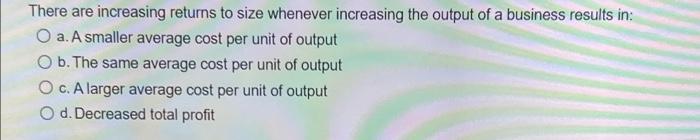
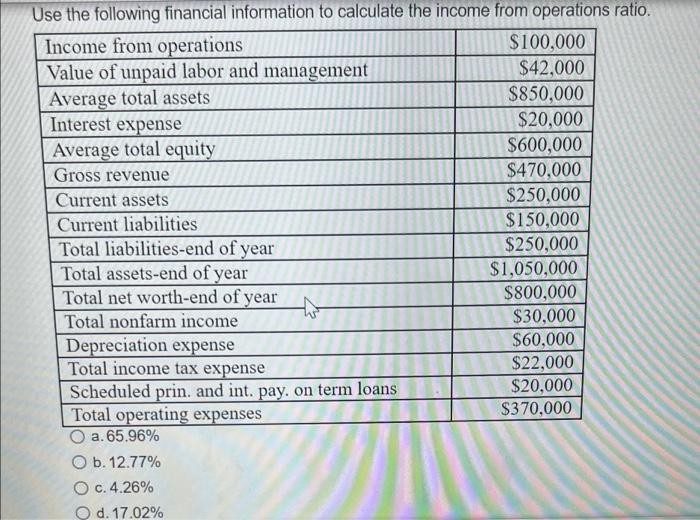
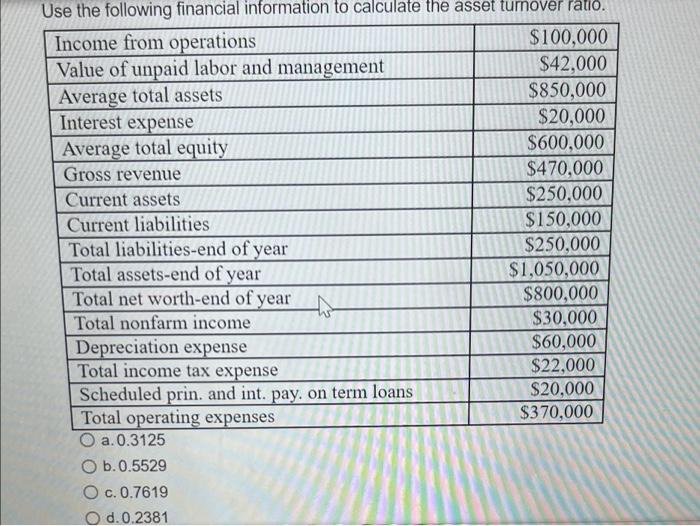
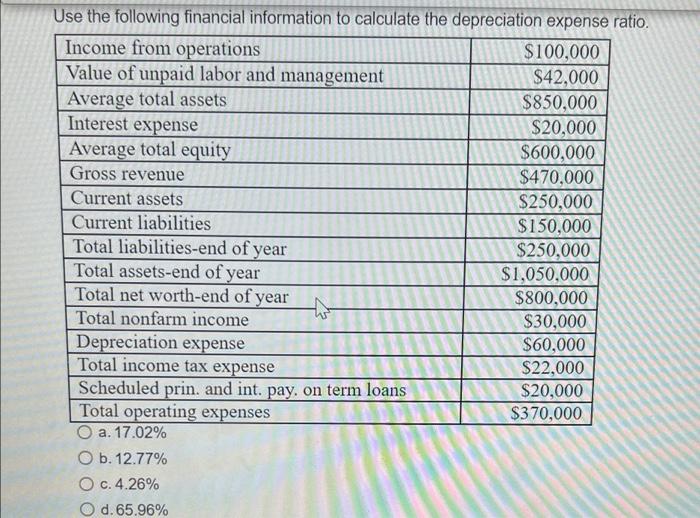
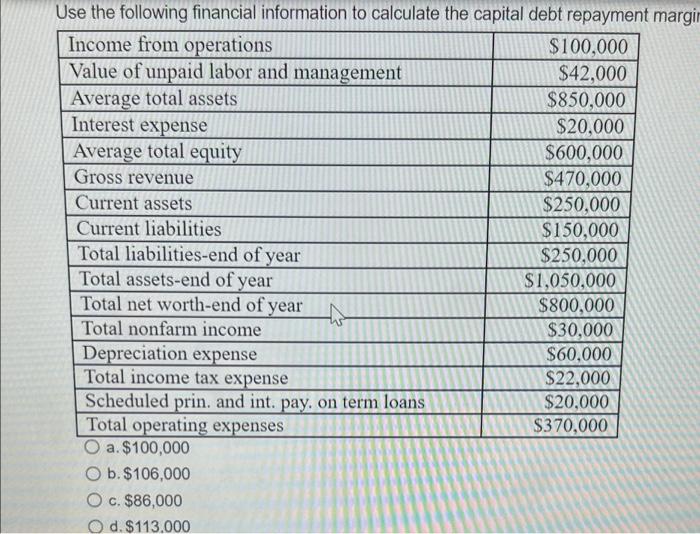
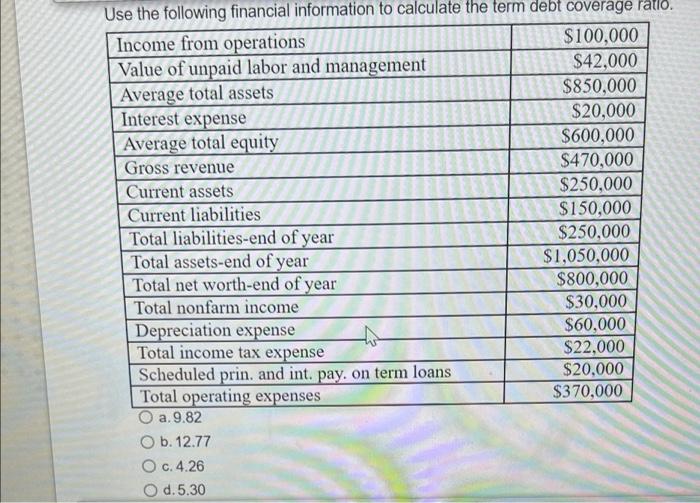
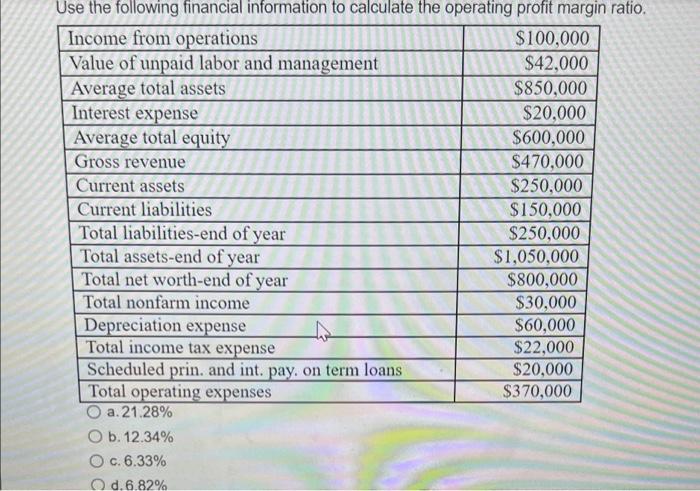
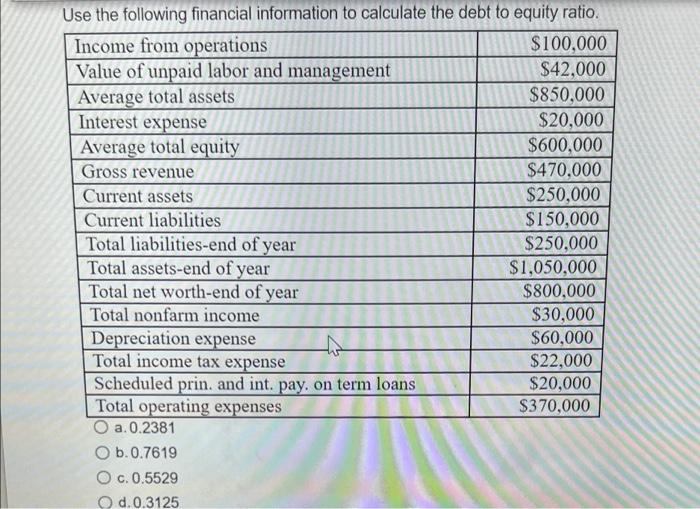
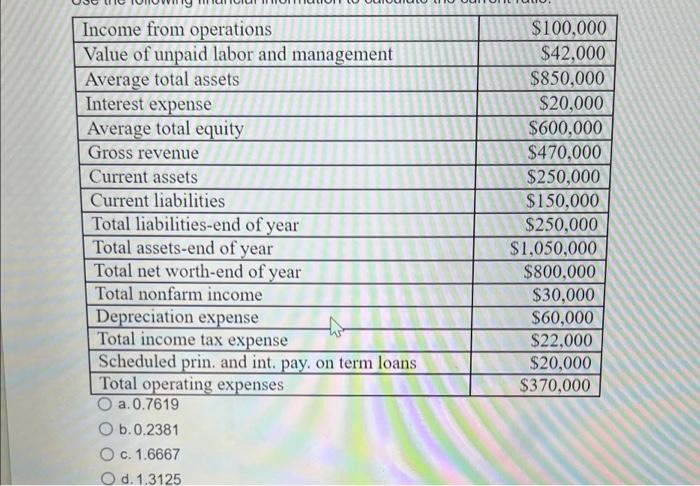
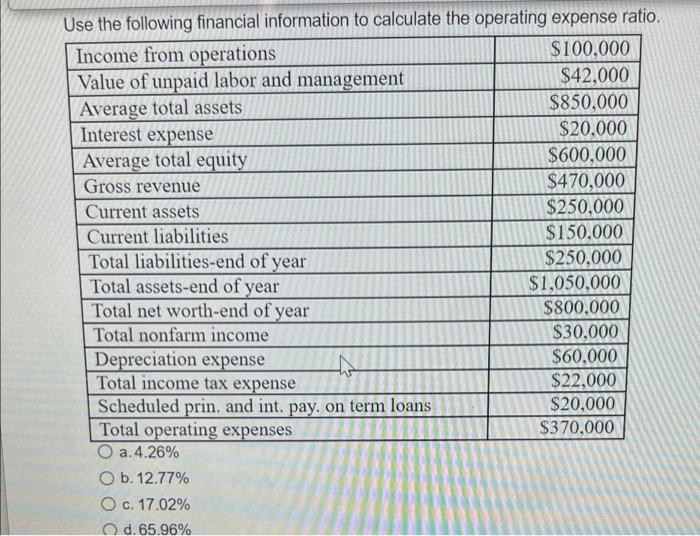
Question: There are increasing returns to size whenever increasing the output of a business results in: O a. A smaller average cost per unit of output
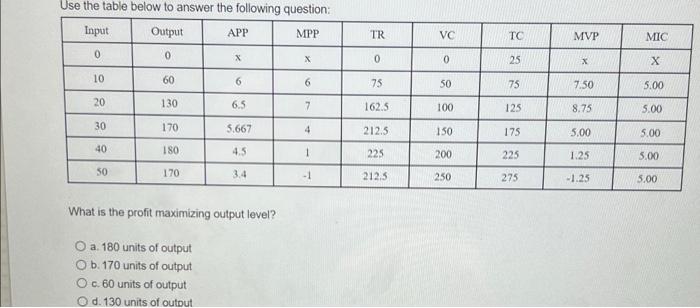
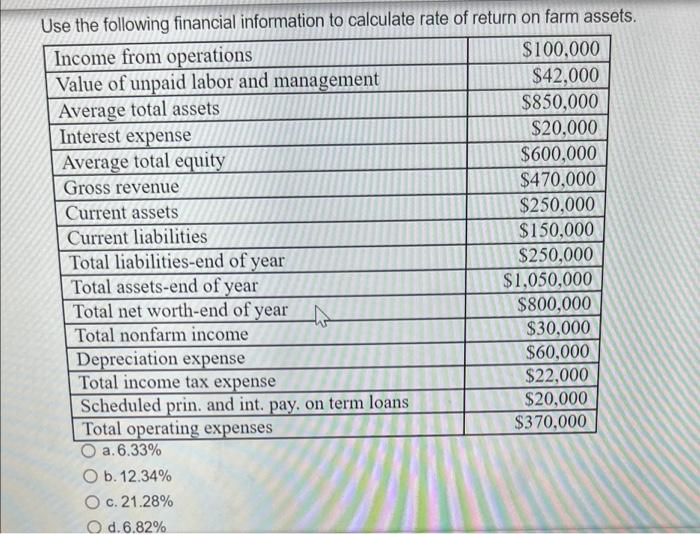
There are increasing returns to size whenever increasing the output of a business results in: O a. A smaller average cost per unit of output O b. The same average cost per unit of output O c. A larger average cost per unit of output O d. Decreased total profit Substitution occurs when a product is purchased or produced in place of another. O True O False Use the table below to answer the following question: Input Output APP MPP 0 0 X TR VC TC MVP MIC X 0 0 25 X 10 60 6 6 75 50 75 7.50 5.00 20 130 6.5 7 162.5 100 125 8.75 5.00 30 170 5.667 4 212.5 150 175 5.00 5.00 40 180 4.5 1 225 200 225 1.25 3.00 50 170 3.4 - 1 212.3 250 275 -1.25 3.00 What is the profit maximizing output level? a. 180 units of output O b. 170 units of output O c. 60 units of output O d. 130 units of output The marginal cost curve: O a. Will eventually increase as output is increased O b. Will continually decrease as output is increased O c. Is constant regardless of output level O d. Has the same shape as the marginal revenue curve Use the following financial information to calculate rate of return on farm assets. Income from operations $100,000 Value of unpaid labor and management $42.000 Average total assets $850,000 Interest expense $20,000 Average total equity $600,000 Gross revenue $470,000 Current assets $250,000 Current liabilities $150,000 Total liabilities-end of year $250,000 Total assets-end of year $1,050,000 Total net worth-end of year $800,000 Total nonfarm income $30,000 Depreciation expense $60,000 Total income tax expense $22,000 Scheduled prin. and int. pay, on term loans $20,000 Total operating expenses $370,000 O a. 6.33% O b. 12.34% O c.21.28% O d.6.82% Use the following financial information to calculate the income from operations ratio. Income from operations $100,000 Value of unpaid labor and management $42.000 Average total assets $850,000 Interest expense $20,000 Average total equity $600,000 Gross revenue $470,000 Current assets $250,000 Current liabilities $150,000 Total liabilities-end of year $250,000 Total assets-end of year $1,050,000 Total net worth-end of year $800,000 Total nonfarm income $30,000 Depreciation expense $60,000 Total income tax expense $22,000 Scheduled prin. and int. pay, on term loans $20,000 Total operating expenses $370,000 a. 65.96% O b. 12.77% O c.4.26% O d. 17.02% Use the following financial information to calculate the asset turnover ratio. Income from operations $100,000 Value of unpaid labor and management $42,000 Average total assets $850,000 Interest expense $20,000 Average total equity $600,000 Gross revenue $470,000 Current assets $250,000 Current liabilities $150,000 Total liabilities-end of year $250,000 Total assets-end of year $1,050,000 Total net worth-end of year $800,000 ho Total nonfarm income $30,000 Depreciation expense $60,000 Total income tax expense $22,000 Scheduled prin. and int, pay, on term loans $20,000 Total operating expenses $370,000 O a.0.3125 O b.0.5529 O c.0.7619 O d.0.2381 Use the following financial information to calculate the depreciation expense ratio. Income from operations $100,000 Value of unpaid labor and management $42.000 Average total assets $850,000 Interest expense $20,000 Average total equity $600,000 Gross revenue $470.000 Current assets $250,000 Current liabilities $150,000 Total liabilities-end of year $250,000 Total assets-end of year $1,050,000 Total net worth-end of year $800,000 Total nonfarm income $30,000 Depreciation expense $60,000 Total income tax expense $22,000 Scheduled prin. and int. pay, on term loans $20,000 Total operating expenses $370,000 O a. 17.02% O b. 12.77% O c. 4.26% O d.65.96% Use the following financial information to calculate the capital debt repayment margir Income from operations $100,000 Value of unpaid labor and management $42,000 Average total assets $850,000 Interest expense $20,000 Average total equity $600,000 Gross revenue $470,000 Current assets $250,000 Current liabilities $150,000 Total liabilities-end of year $250,000 Total assets-end of year $1,050,000 Total net worth-end of year $800,000 Total nonfarm income $30,000 Depreciation expense $60,000 Total income tax expense $22,000 Scheduled prin. and int. pay, on term loans $20,000 Total operating expenses $370,000 O a. $100,000 O b. $106,000 O c. $86,000 O d. $113,000 Use the following financial information to calculate the term debt coverage ratlo. Income from operations $100,000 Value of unpaid labor and management $42.000 Average total assets $850,000 Interest expense $20,000 Average total equity $600,000 Gross revenue $470,000 Current assets $250,000 Current liabilities $150,000 Total liabilities-end of year $250,000 Total assets-end of year $1,050,000 Total net worth-end of year $800,000 Total nonfarm income $30,000 Depreciation expense $60,000 Total income tax expense $22,000 Scheduled prin. and int. pay, on term loans $20,000 Total operating expenses $370,000 O a. 9.82 O b. 12.77 O c.4.26 O d.5.30 Use the following financial information to calculate the operating profit margin ratio. Income from operations $100,000 Value of unpaid labor and management $42.000 Average total assets $850,000 Interest expense $20,000 Average total equity $600,000 Gross revenue $470,000 Current assets $250,000 Current liabilities $150,000 Total liabilities-end of year $250,000 Total assets-end of year $1,050,000 Total net worth-end of year $800,000 Total nonfarm income $30,000 Depreciation expense $60,000 Total income tax expense $22,000 Scheduled prin. and int. pay, on term loans $20,000 Total operating expenses $370,000 O a. 21.28% O b. 12.34% O c. 6.33% O d. 6.82% Use the following financial information to calculate the debt to equity ratio. Income from operations $100,000 Value of unpaid labor and management $42.000 Average total assets $850,000 Interest expense $20,000 Average total equity $600,000 Gross revenue $470,000 Current assets $250,000 Current liabilities $150,000 Total liabilities-end of year $250,000 Total assets-end of year $1,050,000 Total net worth-end of year $800,000 Total nonfarm income $30,000 Depreciation expense tho $60,000 Total income tax expense $22,000 Scheduled prin, and int. pay, on term loans $20,000 Total operating expenses $370,000 a. 0.2381 O b.0.7619 O c.0.5529 O d.0.3125 Income from operations Value of unpaid labor and management Average total assets Interest expense Average total equity Gross revenue Current assets Current liabilities Total liabilities-end of year Total assets-end of year Total net worth-end of year Total nonfarm income Depreciation expense Total income tax expense Scheduled prin. and intpay, on term loans Total operating expenses O a. 0.7619 O b.0.2381 O c. 1.6667 O d. 1.3125 $100,000 $42,000 $850,000 $20,000 $600,000 $470,000 $250,000 $150,000 $250,000 $1,050,000 $800,000 $30,000 $60,000 $22.000 $20,000 $370,000 Use the following financial information to calculate the operating expense ratio. Income from operations $100,000 Value of unpaid labor and management $42.000 $850,000 Average total assets Interest expense $20,000 Average total equity $600,000 Gross revenue $470,000 Current assets $250,000 Current liabilities $150,000 Total liabilities-end of year $250,000 Total assets-end of year $1,050,000 Total net worth-end of year $800,000 Total nonfarm income $30,000 Depreciation expense $60,000 Total income tax expense $22,000 Scheduled prin. and int. pay. on term loans $20,000 Total operating expenses $370,000 O a.4.26% O b. 12.77% O c. 17.02% Od. 65.96%