

Question: There is a 2nd part to this I will be attaching pls see it as well The data in the table to the right are
There is a 2nd part to this I will be attaching pls see it as well

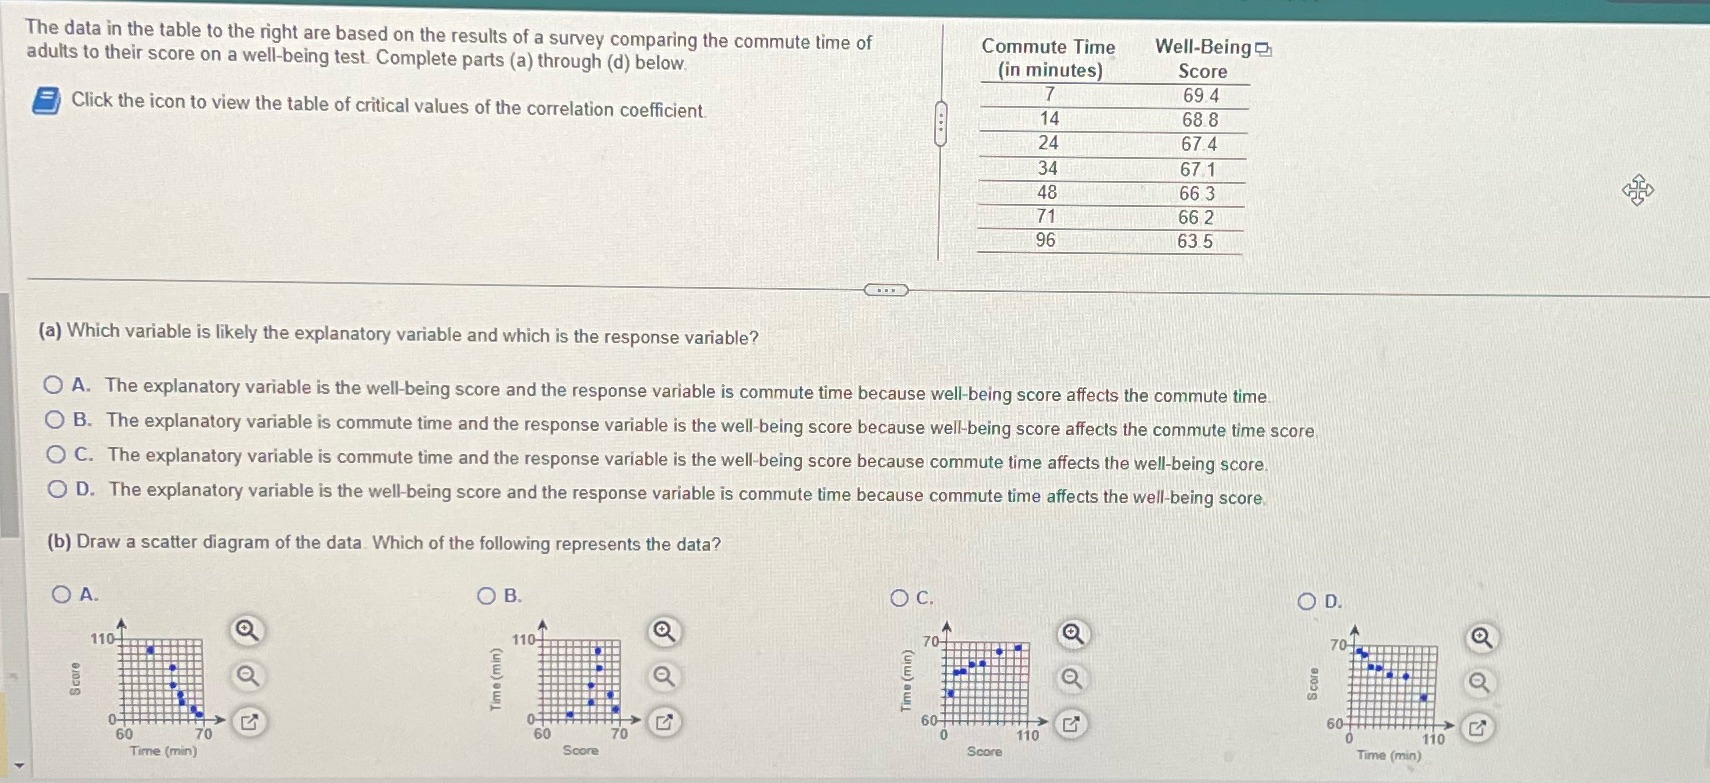
The data in the table to the right are based on the results of a survey comparing the commute time of Commute Time Well-Being adults to their score on a well-being test Complete parts (a) through (d) below. (in minutes) Score 69 4 Click the icon to view the table of critical values of the correlation coefficient 14 68 8 24 67 4 34 67.1 48 66.3 71 66 2 96 63 5 (a) Which variable is likely the explanatory variable and which is the response variable? O A. The explanatory variable is the well-being score and the response variable is commute time because well-being score affects the commute time O B. The explanatory variable is commute time and the response variable is the well-being score because well-being score affects the commute time score O C. The explanatory variable is commute time and the response variable is the well-being score because commute time affects the well-being score. O D. The explanatory variable is the well-being score and the response variable is commute time because commute time affects the well-being score (b) Draw a scatter diagram of the data. Which of the following represents the data? O A. O B. O C. OD. 110 110 70 Score Time (min) Time (min) Score 60-HH 60 70 110 Time (min) Score Score Time (min)
Step by Step Solution
There are 3 Steps involved in it

Get step-by-step solutions from verified subject matter experts