

Question: There is a linear relationship between the l o g * * of plasma concentration ( y ) and time ( x ) for a
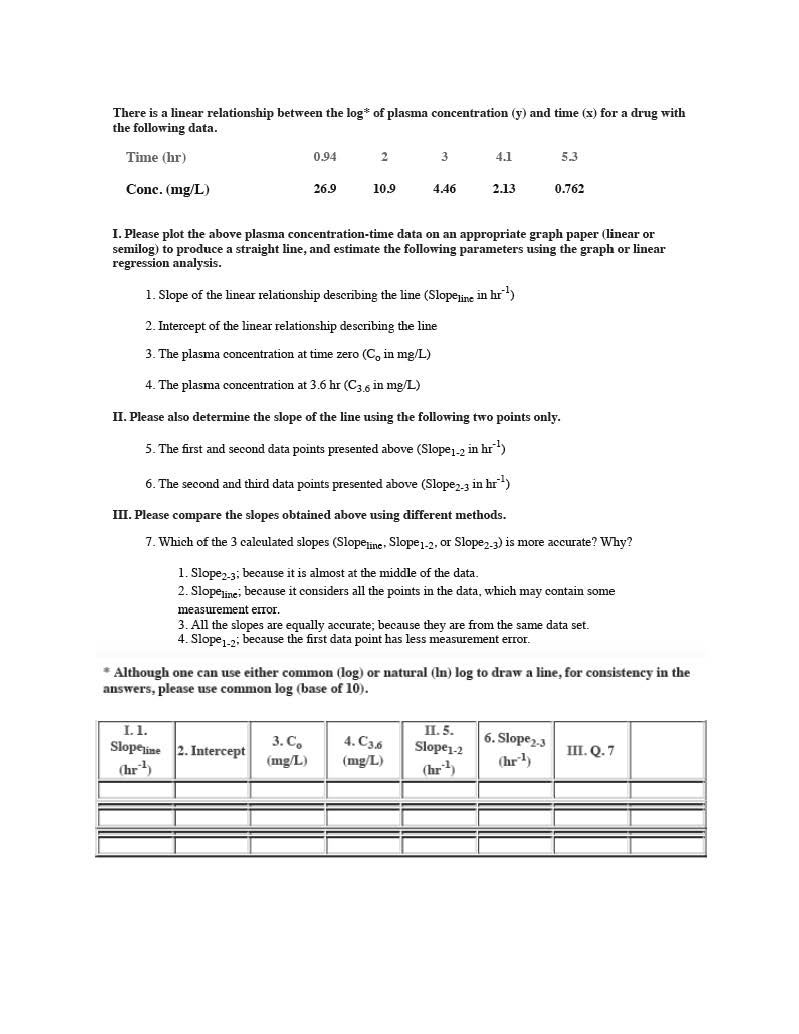
There is a linear relationship between the of plasma concentration y and time x for a drug with
the following data.
I. Please plot the above plasma concentrationtime data on an appropriate graph paper linear or
semilog to produce a straight line, and estimate the following parameters using the graph or linear
regression analysis.
Slope of the linear relationship describing the line Slope line in hr
Intercept of the linear relationship describing the line
The plasma concentration at time zero in :
The plasma concentration at inm
II Please also determine the slope of the line using the following two points only.
The first and second data points presented above Slope in in
The second and third data points presented above Slope
III. Please compare the slopes obtained above using different methods.
Which of the calculated slopes Slope Slope or Slope is more accurate? Why?
Slope ; because it is almost at the middle of the data.
measurement error.
All the slopes are equally accurate; because they are from the same data set.
Slope ; because the first data point has less measurement error.
Although one can use either common log or natural ln log to draw a line, for consistency in the
answers, please use common log base of
Step by Step Solution
There are 3 Steps involved in it
1 Expert Approved Answer
Step: 1 Unlock

Question Has Been Solved by an Expert!
Get step-by-step solutions from verified subject matter experts
Step: 2 Unlock
Step: 3 Unlock