

Question: There is a proposal for a $ 50 million expansion for Hanson Private Label or HPL. HPL manufactured personal care products such as soap, shampoo,
There is a proposal for a $ 50 million expansion for Hanson Private Label or HPL. HPL manufactured personal care products such as soap, shampoo, and mouthwash The proposed expansion is HPLs response to a retail customers desire to expand HPLs share of their private label manufacturing. Consider the firms overall competitive strategy and proceed as follows:
1. Use Exhibit 1 to obtain the firms profitability, growth rate, and leverage versus its competitors.
2. Estimate the projects NPV. Would you recommend that Tucker Hanson proceed with the investment?
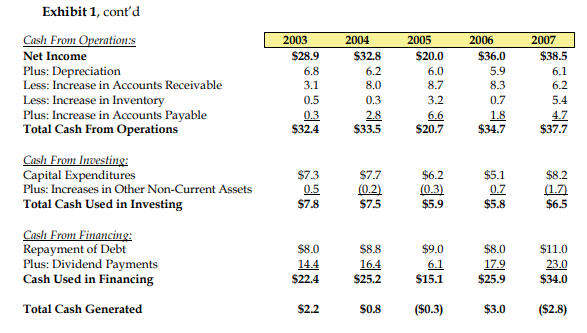
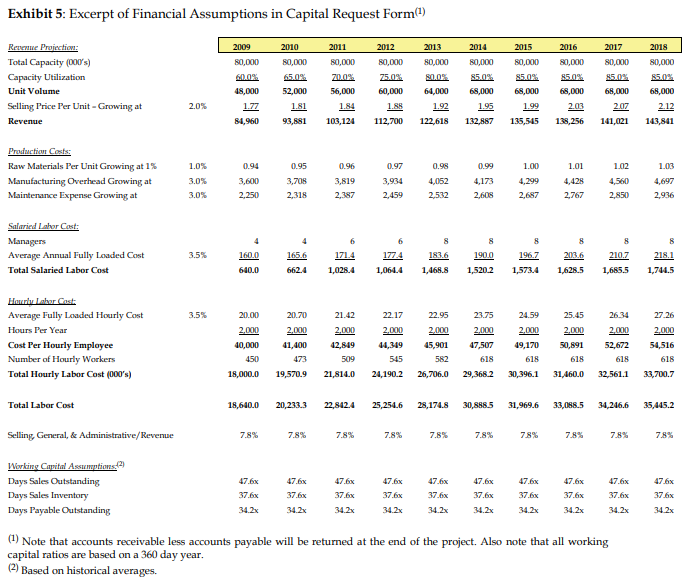
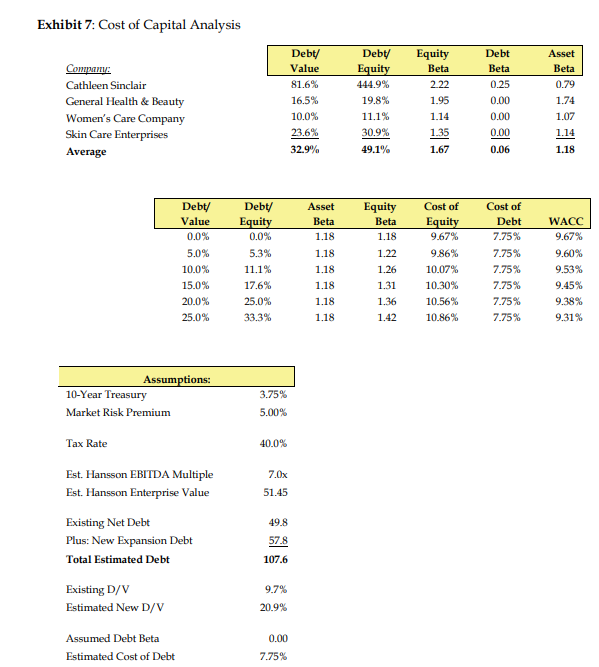
Exhibit 1, cont'd Cash From Operation: Net Income Plus: Depreciation Less: Increase in Accounts Receivable Less: Increase in Inventory Plus: Increase in Accounts Payable Total Cash From Operations 2003 $28.9 6.8 3.1 2004 $32.8 6.2 8.0 0.3 2.8 $33.5 2005 $20.0 6.0 8.7 3.2 6.6 $20.7 2006 $36.0 5.9 8.3 0.7 1.8 $34.7 2007 $38.5 6.1 6.2 5.4 0.5 0.3 4.7 $37.7 $32.4 Cash From Investing: Capital Expenditures Plus: Increases in Other Non-Current Assets Total Cash Used in Investing $73 0.5 $7.8 $7.7 (0.2) $7.5 $6.2 (0.3) $5.9 $5.1 0.7 $5.8 $8.2 (1.7) $6.5 Cash From Financing: Repayment of Debt Plus: Dividend Payments Cash Used in Financing $8.0 14.4 $22.4 $8.8 16.4 $25.2 $9.0 6.1 $15.1 $8.0 17.9 $25.9 $11.0 23.0 $34.0 Total Cash Generated $2.2 $0.8 ($0.3) $3.0 ($2.8) Exhibit 5: Excerpt of Financial Assumptions in Capital Request Form) 2013 2015 2016 2018 Resume Projection: Total Capacity (000's) Capacity Utilization Unit Volume Selling Price Per Unit - Growing at Revenue 2009 80,000 60.0% 48,000 1.77 84,960 2010 80,000 65.0% 52,000 1.81 93,881 2011 80,000 20.0% 56,000 1.84 103,124 2012 80,000 25.0% 60,000 1.85 112,700 80,000 500s 64,000 2014 80,000 85.0% 68,000 1.95 132,887 80,000 85.0%. 68,000 1.99 135,545 80,000 85.0% 68,000 2.03 138,256 2017 80,000 85.0% 68,000 2.07 141,021 80,000 85.00 68,000 2.12 2.0% 1.92 122,618 143,841 0.94 0.95 0.96 0.98 1.01 1.03 Production Costs: Raw Materials Per Unit Growing at 1% Manufacturing Overhead Growing at Maintenance Expense Growing at 1.0% 3.0% 3.0% 3,600 2.250 3.705 2,318 3,819 2.187 0.97 3,934 2,459 4,052 2.532 0.99 4,173 2,608 1.00 4,299 2.687 4,428 2,767 1.02 4,560 2,850 4,697 2,936 6 S Salaried Lahar Cost Managers Average Annual Fully Loaded Cost Total Salaried Labor Cost 3.5% 160.0 165.6 183.6 190.0 203.6 1714 1,028.4 177.4 1,064.4 196.7 1,573.4 210.7 1,6855 218.1 1,744.5 640.0 662.4 1,468.8 1,520.2 1,628.5 3.5% 25.45 27.26 Hour Lahar Cost: Average Fully Loaded Hourly Cost Hours Per Year Cost Per Hourly Employee Number of Hourly Workers Total Hourly Labor Cost (000's) 20.00 2.000 40,000 450 18,000.0 20.70 2.000 41,400 473 19,570.9 21.42 2.000 42,849 509 21,814.0 22.17 2,000 44,349 545 24,190.2 22.95 2,000 45,901 582 26,706.0 23.75 2.000 47,507 618 24.59 2.000 49,170 618 30,396.1 2.000 50,891 618 31,460.0 26.34 2,000 52,672 618 32,561.1 2,000 54,516 618 33,700.7 29,368.2 Total Labor Cost 18,640.0 20,233.3 22,842.4 25,254.6 28,174.8 30,888.5 31,969.6 33,088.5 34,246.6 35,445.2 Selling General, & Administrative/Revenue 7.8% 7.8% 7.8% 7.8% 7.8% 7.8% 7.8% 7.8% 7.8% 7.8% 47.6% 47.6% 47.6% 47.6% 47.6% 47.6% 47.6x 47.6x Working Capital Assumptions: Days Sales Outstanding Days Sales Inventory Days Payable Outstanding 47.6% 37.6x 37.6x 37.6x 37.6% 37.6% 34.2x 376x 37.6 34.2x 37.6 34.2x 47.6% 37.6x 34.2x 37.6% 34.2x 34.2x 34.2x 34.2x 34.2x (1) Note that accounts receivable less accounts payable will be returned at the end of the project. Also note that all working capital ratios are based on a 360 day year. (2) Based on historical averages. Exhibit 7: Cost of Capital Analysis Company: Cathleen Sinclair General Health & Beauty Women's Care Company Skin Care Enterprises Average Debt/ Value 81.6% 16.5% 10.0% 23.6% 32.9% Debt Equity 444.9% 19.8% 11.1% 30.9% 49.1% Equity Beta 2.22 1.95 1.14 1.35 Debt Beta 0.25 0.00 0.00 0.00 0.06 Asset Beta 0.79 1.74 1.07 1.14 1.18 1.67 Asset Beta 1.18 Debt/ Value 0.0% 5.0% 10.0% 15.0% 20.0% 25.0% Debt/ Equity 0.0% 5.3% 11.1% 17.6% 1.18 1.18 1.18 1.18 1.18 Equity Beta 1.18 1.22 1.26 1.31 1.36 1.42 Cost of Equity 9.67% 9.86% 10.07% 10.30% 10.56% 10.86% Cost of Debt 7.75% 7.75% 7.75% 7.75% 7.75% 7.75% WACC 9.67% 9.60% 9.53% 9.45% 9.38% 9.31% 25.0% 33.3% Assumptions: 10-Year Treasury Market Risk Premium 3.75% 5.00% Tax Rate 40.0% 7.Ox 51.45 Est. Hansson EBITDA Multiple Est. Hansson Enterprise Value Existing Net Debt Plus: New Expansion Debt Total Estimated Debt 49.8 57.8 107.6 Existing D/V Estimated New D/V 9.7% 20.9% 0.00 Assumed Debt Beta Estimated Cost of Debt 7.75% Exhibit 1, cont'd Cash From Operation: Net Income Plus: Depreciation Less: Increase in Accounts Receivable Less: Increase in Inventory Plus: Increase in Accounts Payable Total Cash From Operations 2003 $28.9 6.8 3.1 2004 $32.8 6.2 8.0 0.3 2.8 $33.5 2005 $20.0 6.0 8.7 3.2 6.6 $20.7 2006 $36.0 5.9 8.3 0.7 1.8 $34.7 2007 $38.5 6.1 6.2 5.4 0.5 0.3 4.7 $37.7 $32.4 Cash From Investing: Capital Expenditures Plus: Increases in Other Non-Current Assets Total Cash Used in Investing $73 0.5 $7.8 $7.7 (0.2) $7.5 $6.2 (0.3) $5.9 $5.1 0.7 $5.8 $8.2 (1.7) $6.5 Cash From Financing: Repayment of Debt Plus: Dividend Payments Cash Used in Financing $8.0 14.4 $22.4 $8.8 16.4 $25.2 $9.0 6.1 $15.1 $8.0 17.9 $25.9 $11.0 23.0 $34.0 Total Cash Generated $2.2 $0.8 ($0.3) $3.0 ($2.8) Exhibit 5: Excerpt of Financial Assumptions in Capital Request Form) 2013 2015 2016 2018 Resume Projection: Total Capacity (000's) Capacity Utilization Unit Volume Selling Price Per Unit - Growing at Revenue 2009 80,000 60.0% 48,000 1.77 84,960 2010 80,000 65.0% 52,000 1.81 93,881 2011 80,000 20.0% 56,000 1.84 103,124 2012 80,000 25.0% 60,000 1.85 112,700 80,000 500s 64,000 2014 80,000 85.0% 68,000 1.95 132,887 80,000 85.0%. 68,000 1.99 135,545 80,000 85.0% 68,000 2.03 138,256 2017 80,000 85.0% 68,000 2.07 141,021 80,000 85.00 68,000 2.12 2.0% 1.92 122,618 143,841 0.94 0.95 0.96 0.98 1.01 1.03 Production Costs: Raw Materials Per Unit Growing at 1% Manufacturing Overhead Growing at Maintenance Expense Growing at 1.0% 3.0% 3.0% 3,600 2.250 3.705 2,318 3,819 2.187 0.97 3,934 2,459 4,052 2.532 0.99 4,173 2,608 1.00 4,299 2.687 4,428 2,767 1.02 4,560 2,850 4,697 2,936 6 S Salaried Lahar Cost Managers Average Annual Fully Loaded Cost Total Salaried Labor Cost 3.5% 160.0 165.6 183.6 190.0 203.6 1714 1,028.4 177.4 1,064.4 196.7 1,573.4 210.7 1,6855 218.1 1,744.5 640.0 662.4 1,468.8 1,520.2 1,628.5 3.5% 25.45 27.26 Hour Lahar Cost: Average Fully Loaded Hourly Cost Hours Per Year Cost Per Hourly Employee Number of Hourly Workers Total Hourly Labor Cost (000's) 20.00 2.000 40,000 450 18,000.0 20.70 2.000 41,400 473 19,570.9 21.42 2.000 42,849 509 21,814.0 22.17 2,000 44,349 545 24,190.2 22.95 2,000 45,901 582 26,706.0 23.75 2.000 47,507 618 24.59 2.000 49,170 618 30,396.1 2.000 50,891 618 31,460.0 26.34 2,000 52,672 618 32,561.1 2,000 54,516 618 33,700.7 29,368.2 Total Labor Cost 18,640.0 20,233.3 22,842.4 25,254.6 28,174.8 30,888.5 31,969.6 33,088.5 34,246.6 35,445.2 Selling General, & Administrative/Revenue 7.8% 7.8% 7.8% 7.8% 7.8% 7.8% 7.8% 7.8% 7.8% 7.8% 47.6% 47.6% 47.6% 47.6% 47.6% 47.6% 47.6x 47.6x Working Capital Assumptions: Days Sales Outstanding Days Sales Inventory Days Payable Outstanding 47.6% 37.6x 37.6x 37.6x 37.6% 37.6% 34.2x 376x 37.6 34.2x 37.6 34.2x 47.6% 37.6x 34.2x 37.6% 34.2x 34.2x 34.2x 34.2x 34.2x (1) Note that accounts receivable less accounts payable will be returned at the end of the project. Also note that all working capital ratios are based on a 360 day year. (2) Based on historical averages. Exhibit 7: Cost of Capital Analysis Company: Cathleen Sinclair General Health & Beauty Women's Care Company Skin Care Enterprises Average Debt/ Value 81.6% 16.5% 10.0% 23.6% 32.9% Debt Equity 444.9% 19.8% 11.1% 30.9% 49.1% Equity Beta 2.22 1.95 1.14 1.35 Debt Beta 0.25 0.00 0.00 0.00 0.06 Asset Beta 0.79 1.74 1.07 1.14 1.18 1.67 Asset Beta 1.18 Debt/ Value 0.0% 5.0% 10.0% 15.0% 20.0% 25.0% Debt/ Equity 0.0% 5.3% 11.1% 17.6% 1.18 1.18 1.18 1.18 1.18 Equity Beta 1.18 1.22 1.26 1.31 1.36 1.42 Cost of Equity 9.67% 9.86% 10.07% 10.30% 10.56% 10.86% Cost of Debt 7.75% 7.75% 7.75% 7.75% 7.75% 7.75% WACC 9.67% 9.60% 9.53% 9.45% 9.38% 9.31% 25.0% 33.3% Assumptions: 10-Year Treasury Market Risk Premium 3.75% 5.00% Tax Rate 40.0% 7.Ox 51.45 Est. Hansson EBITDA Multiple Est. Hansson Enterprise Value Existing Net Debt Plus: New Expansion Debt Total Estimated Debt 49.8 57.8 107.6 Existing D/V Estimated New D/V 9.7% 20.9% 0.00 Assumed Debt Beta Estimated Cost of Debt 7.75%
Step by Step Solution
There are 3 Steps involved in it

Get step-by-step solutions from verified subject matter experts