

Question: There is a task and correct answers to the task. I would need the full solutions with all the calculations. Thanks 12.66 You want to
There is a task and correct answers to the task. I would need the full solutions with all the calculations. Thanks
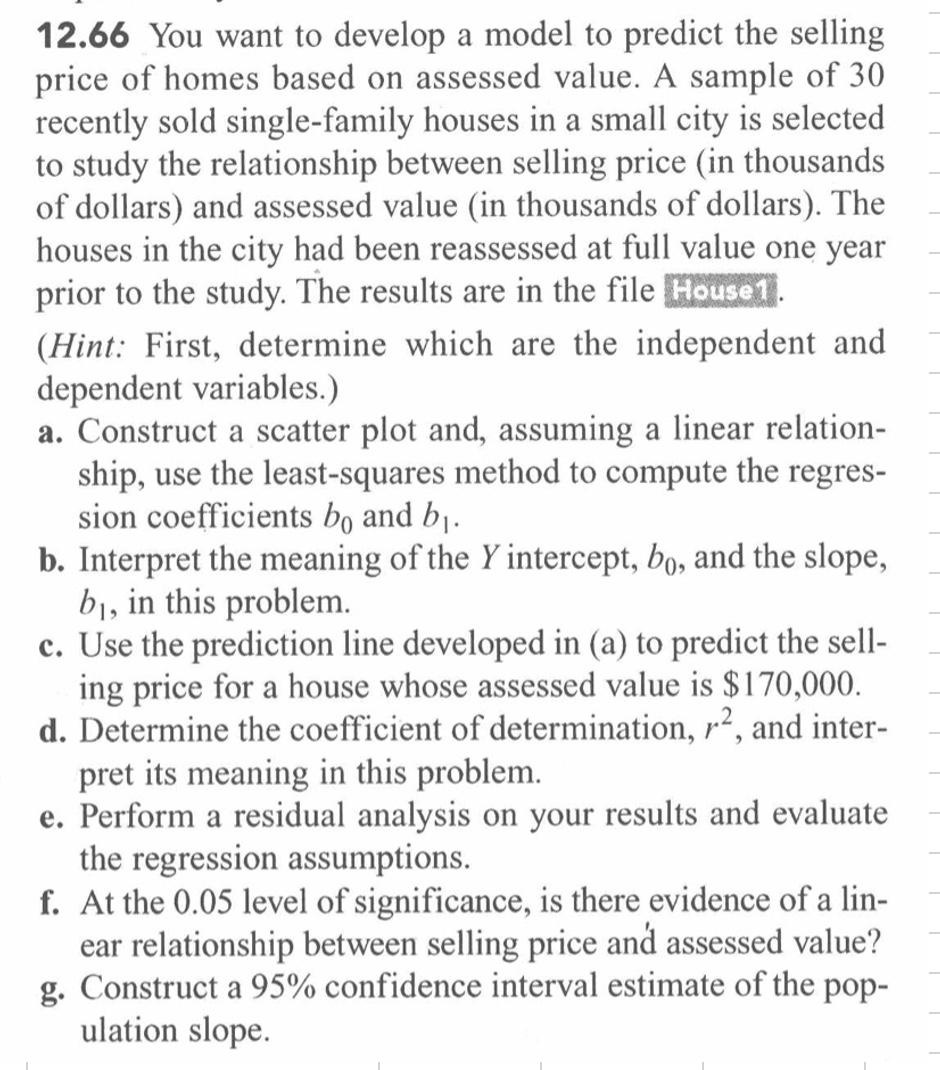
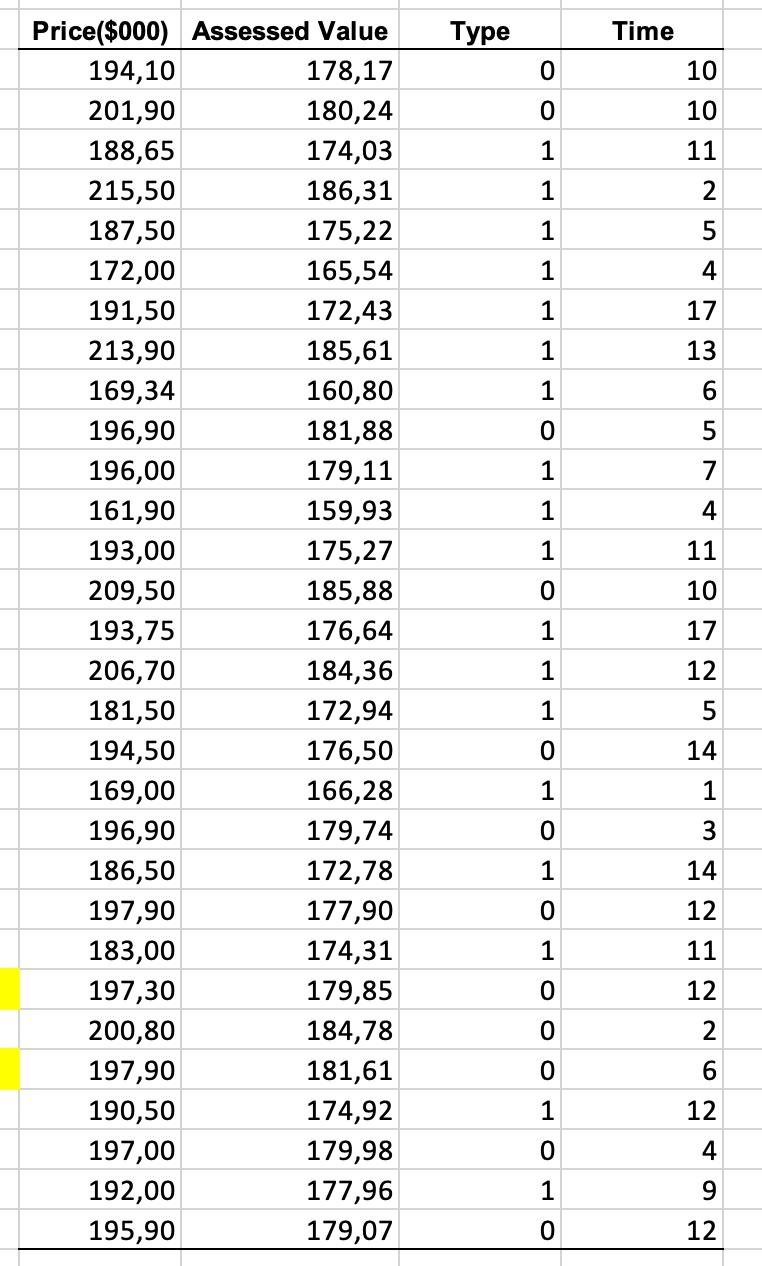
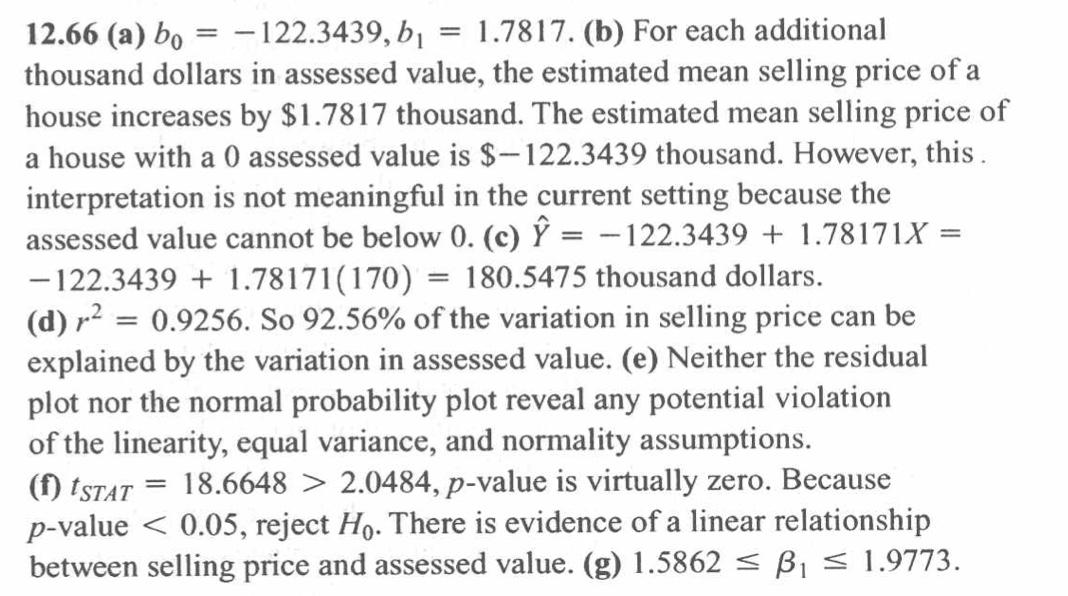
12.66 You want to develop a model to predict the selling price of homes based on assessed value. A sample of 30 recently sold single-family houses in a small city is selected to study the relationship between selling price (in thousands of dollars) and assessed value (in thousands of dollars). The houses in the city had been reassessed at full value one year prior to the study. The results are in the file House 1 (Hint: First, determine which are the independent and dependent variables.) a. Construct a scatter plot and, assuming a linear relation- ship, use the least-squares method to compute the regres- sion coefficients bo and b. b. Interpret the meaning of the Y intercept, bo, and the slope, b, in this problem. c. Use the prediction line developed in (a) to predict the sell- ing price for a house whose assessed value is $170,000. d. Determine the coefficient of determination, r2, and inter- pret its meaning in this problem. e. Perform a residual analysis on your results and evaluate the regression assumptions. f. At the 0.05 level of significance, is there evidence of a lin- ear relationship between selling price and assessed value? g. Construct a 95% confidence interval estimate of the pop- ulation slope. Type Time O 10 0 10 1 11 1 2 1 1 4 A 1 17 1 13 1 6 0 5 7 1 1 4 1 11 0 10 Price($000) Assessed Value 194,10 178,17 201,90 180,24 188,65 174,03 215,50 186,31 187,50 175,22 172,00 165,54 191,50 172,43 213,90 185,61 169,34 160,80 196,90 181,88 196,00 179,11 161,90 159,93 193,00 175,27 209,50 185,88 193,75 176,64 206,70 184,36 181,50 172,94 194,50 176,50 169,00 166,28 196,90 179,74 186,50 172,78 197,90 177,90 183,00 174,31 197,30 179,85 200,80 184,78 197,90 181,61 190,50 174,92 197,00 179,98 192,00 177,96 195,90 179,07 1 17 1 12 1 5 0 14 1 1 WA 0 3 1 14 0 12 1 11 0 12 0 2 0 6 1 12 0 4 4 1 9 O 12 = 12.66 (a) bo -122.3439,b1 1.7817. (b) For each additional thousand dollars in assessed value, the estimated mean selling price of a house increases by $1.7817 thousand. The estimated mean selling price of a house with a 0 assessed value is $-122.3439 thousand. However, this. interpretation is not meaningful in the current setting because the assessed value cannot be below 0. (c) = - 122.3439 + 1.78171X = - 122.3439 + 1.78171(170) = 180.5475 thousand dollars. (d) r2 = 0.9256. So 92.56% of the variation in selling price can be explained by the variation in assessed value. (e) Neither the residual plot nor the normal probability plot reveal any potential violation of the linearity, equal variance, and normality assumptions. (1) tstat = 18.6648 > 2.0484, p-value is virtually zero. Because p-valueStep by Step Solution
There are 3 Steps involved in it
1 Expert Approved Answer
Step: 1 Unlock

Question Has Been Solved by an Expert!
Get step-by-step solutions from verified subject matter experts
Step: 2 Unlock
Step: 3 Unlock