

Question: There is also a chart that needs charting but it would not fit in the picture 9. Firm's Cost Schedule Yakov's Juice Bar has the
There is also a chart that needs charting but it would not fit in the picture
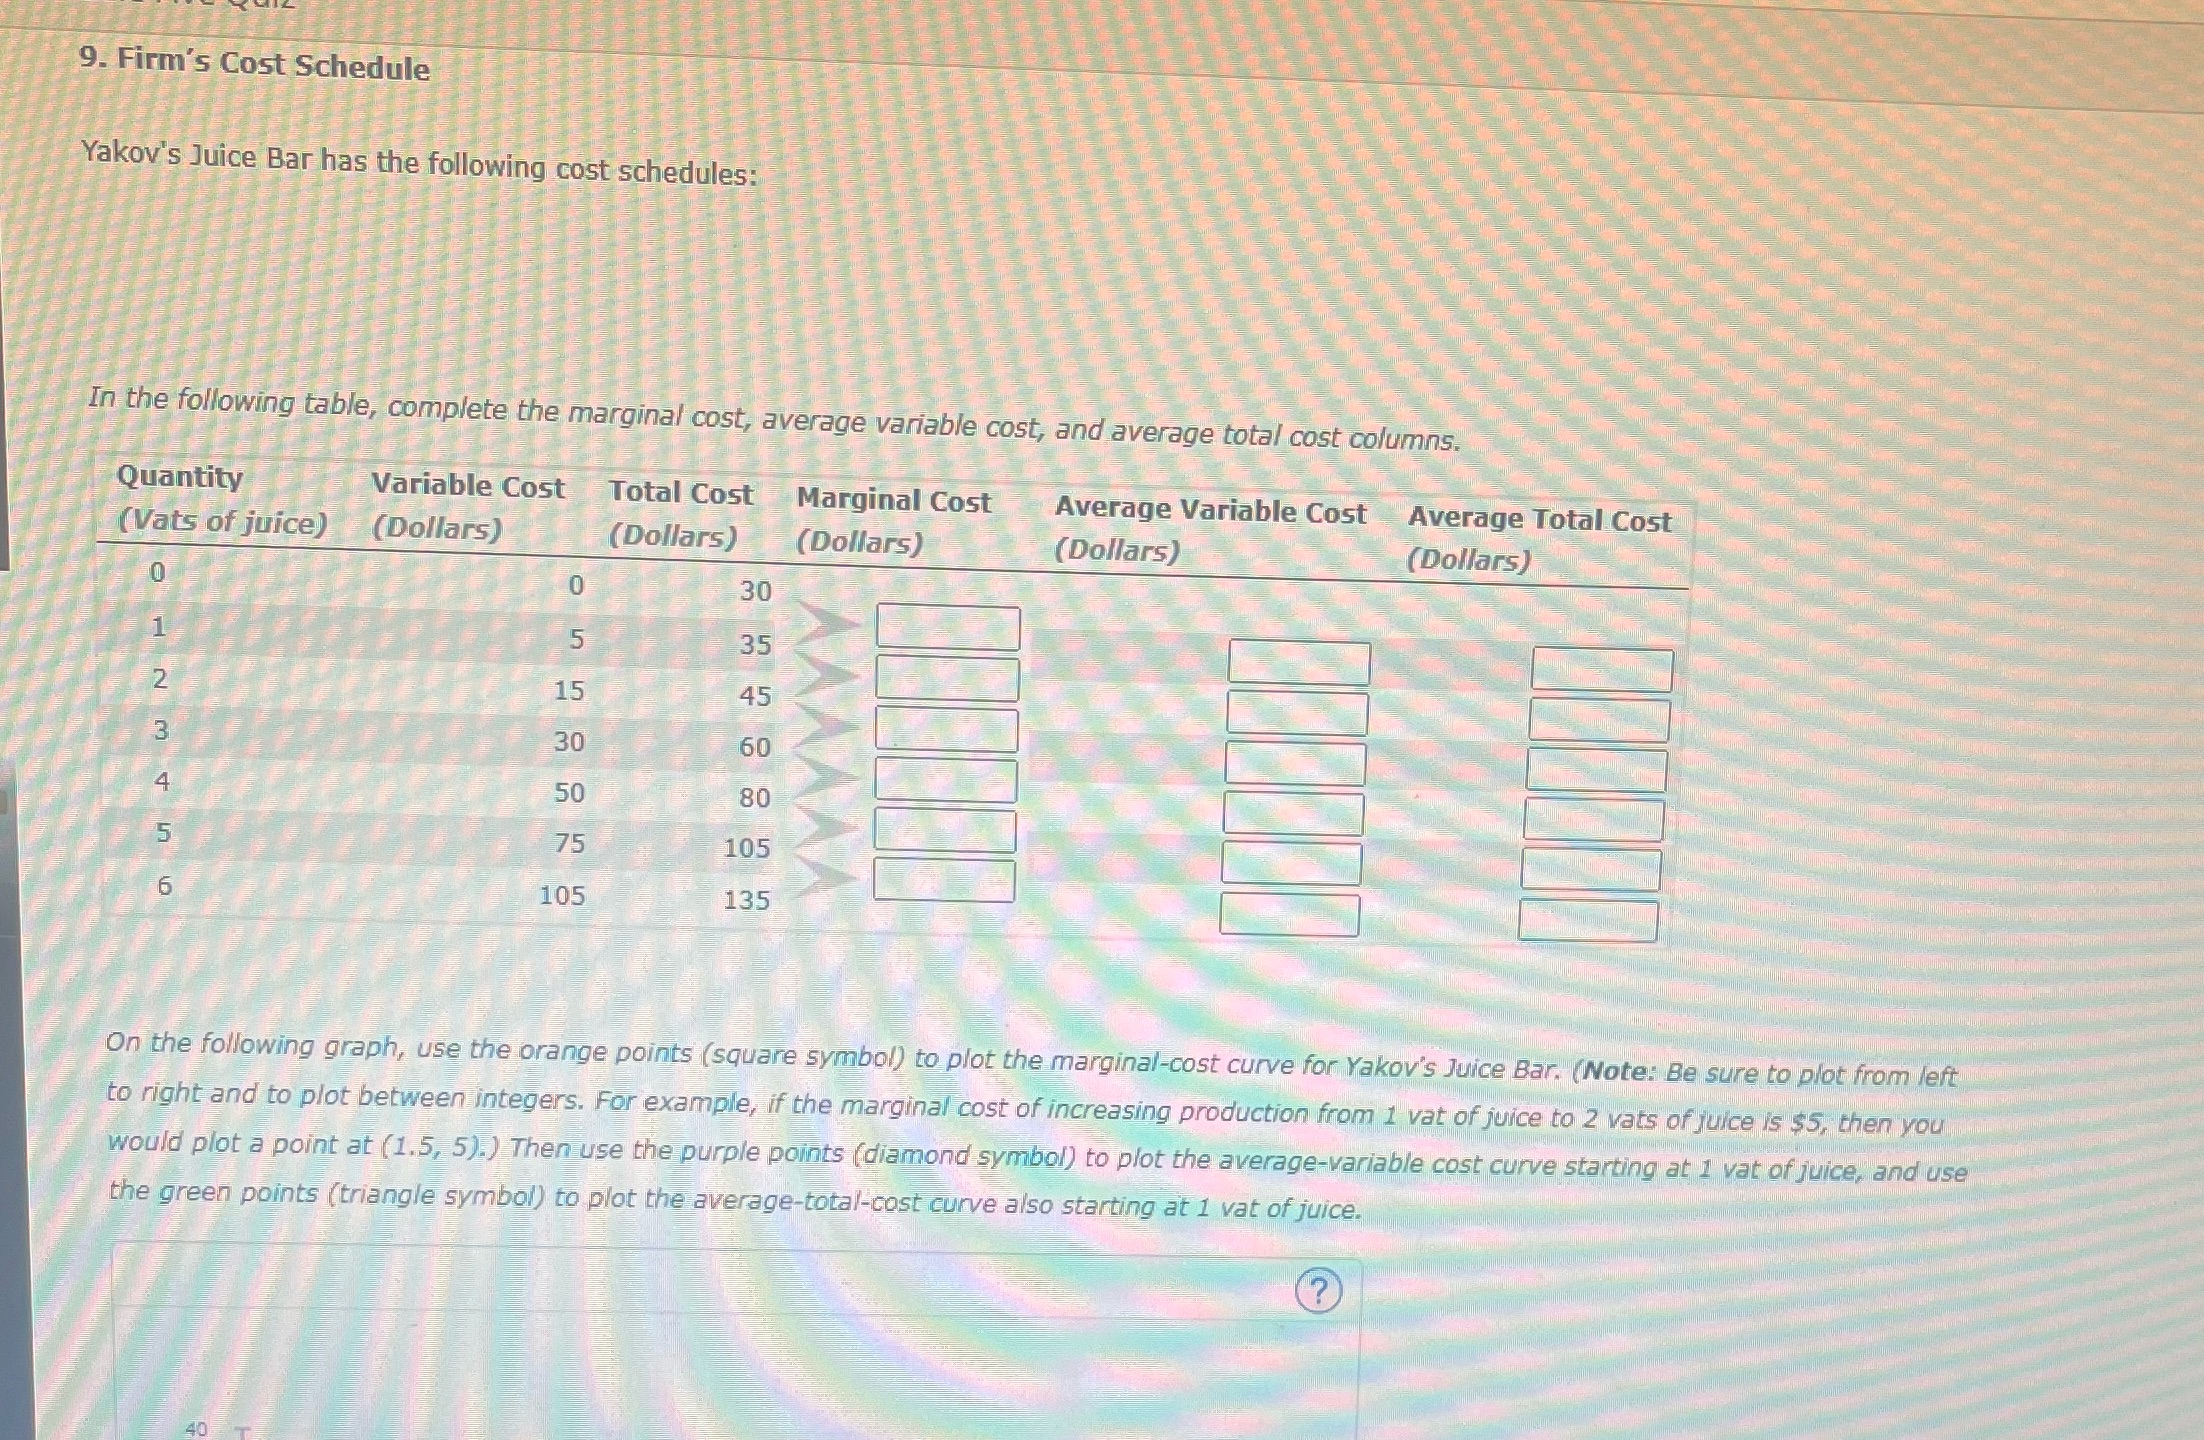
9. Firm's Cost Schedule Yakov's Juice Bar has the following cost schedules: In the following table, complete the marginal cost, average variable cost, and average total cost columns. Quantity Variable Cost .Total Cost . Marginal Cost Average Variable Cost Average Total Cost (Vats of juice) (Dollars) (Dollars) (Dollars) (Dollars) (Dollars) 0 30 5 35 15 45 30 60 50 80 75 105 105 135 On the following graph, use the orange points (square symbol) to plot the marginal-cost curve for Yakov's Juice Bar. (Note: Be sure to plot from left. to right and to plot between integers. For example, if the marginal cost of increasing production from 1 vat of juice to 2 vats of juice is $5, then you would plot a point at (1.5, 5).) Then use the purple points (diamond symbol) to plot the average-variable cost curve starting at 1 vat of juice, and use the green points (triangle symbol) to plot the average-total-cost curve also starting at 1 vat of juice
Step by Step Solution
There are 3 Steps involved in it

Get step-by-step solutions from verified subject matter experts