

Question: THERE IS MORE THAN ONE ANSWER - CHECK ALL THAT APPLY To be clear points #1 and 2 on the range chart are both below
THERE IS MORE THAN ONE ANSWER - CHECK ALL THAT APPLY
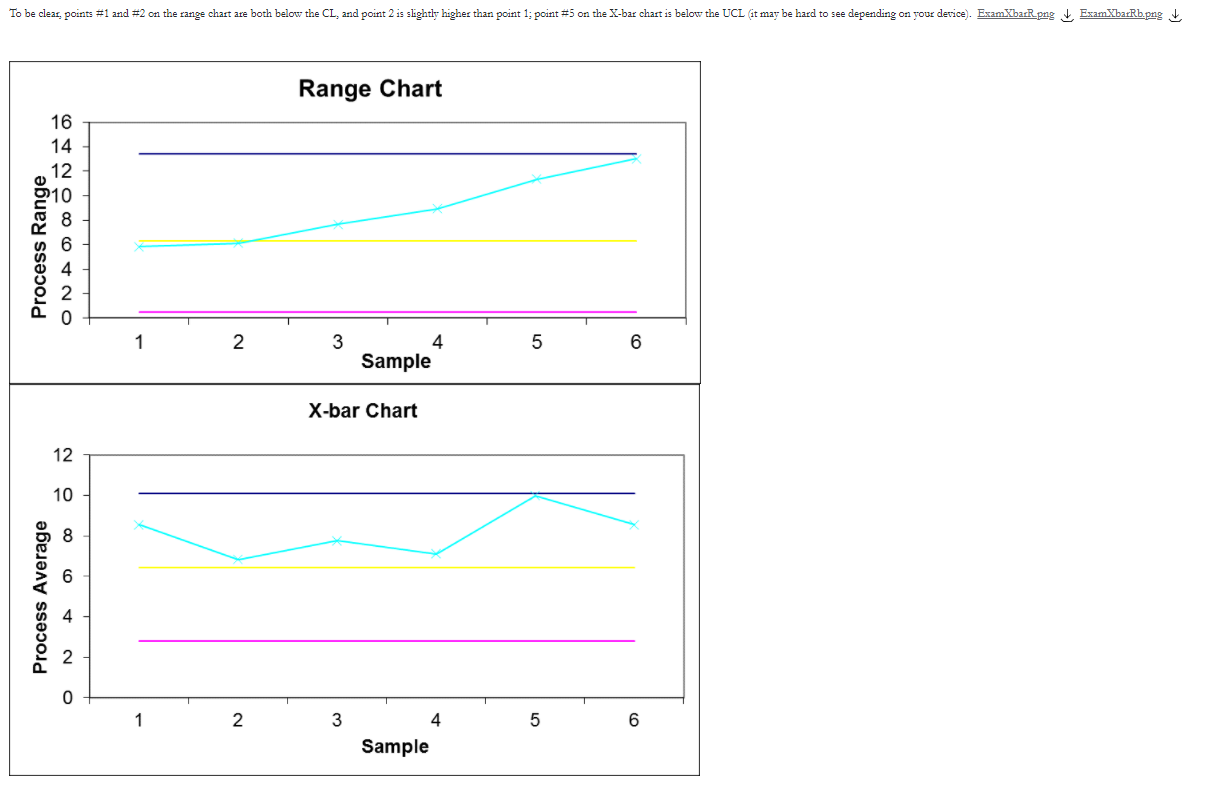
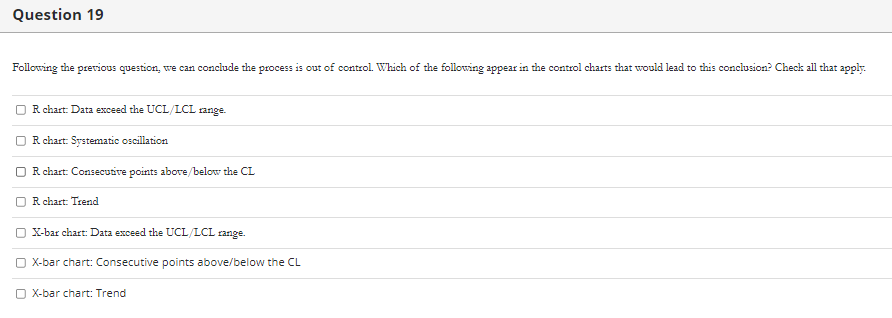
To be clear points #1 and 2 on the range chart are both below the CL, and point 2 is sightly higher than point 1; point #5 on the X-bar chart is below the UCL (it may be hard to see depending on your device). ExamXbaci_png ExamXbaRb.png Range Chart Process Range ONA O OO 1 2 3 5 6 4 Sample X-bar Chart 12 10 O Process Average 1 2 3 5 6 4 Sample Question 19 Following the previous question, we can conclude the process is out of control. Which of the following appear in the control charts that would lead to this conclusion? Check all that apply. Rchart: Data exceed the UCL/LCL range. Rchart. Systematic oscillation U R chart: Consecutive points above/below the CL O R chart: Trend X-bar chart: Data exceed the UCL/LCL range. X-bar chart: Consecutive points above/below the CL O X-bar chart: TrendStep by Step Solution
There are 3 Steps involved in it
1 Expert Approved Answer
Step: 1 Unlock

Question Has Been Solved by an Expert!
Get step-by-step solutions from verified subject matter experts
Step: 2 Unlock
Step: 3 Unlock