

Question: there is only 2 options for the chart A and B The following table summarizes prices of various default-free zero-coupon bonds ($100 face value): Maturity
there is only 2 options for the chart A and B
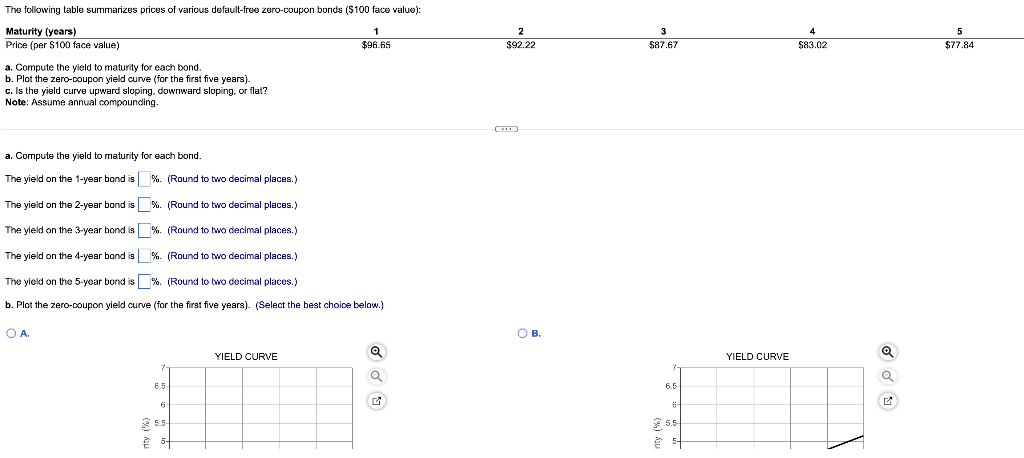
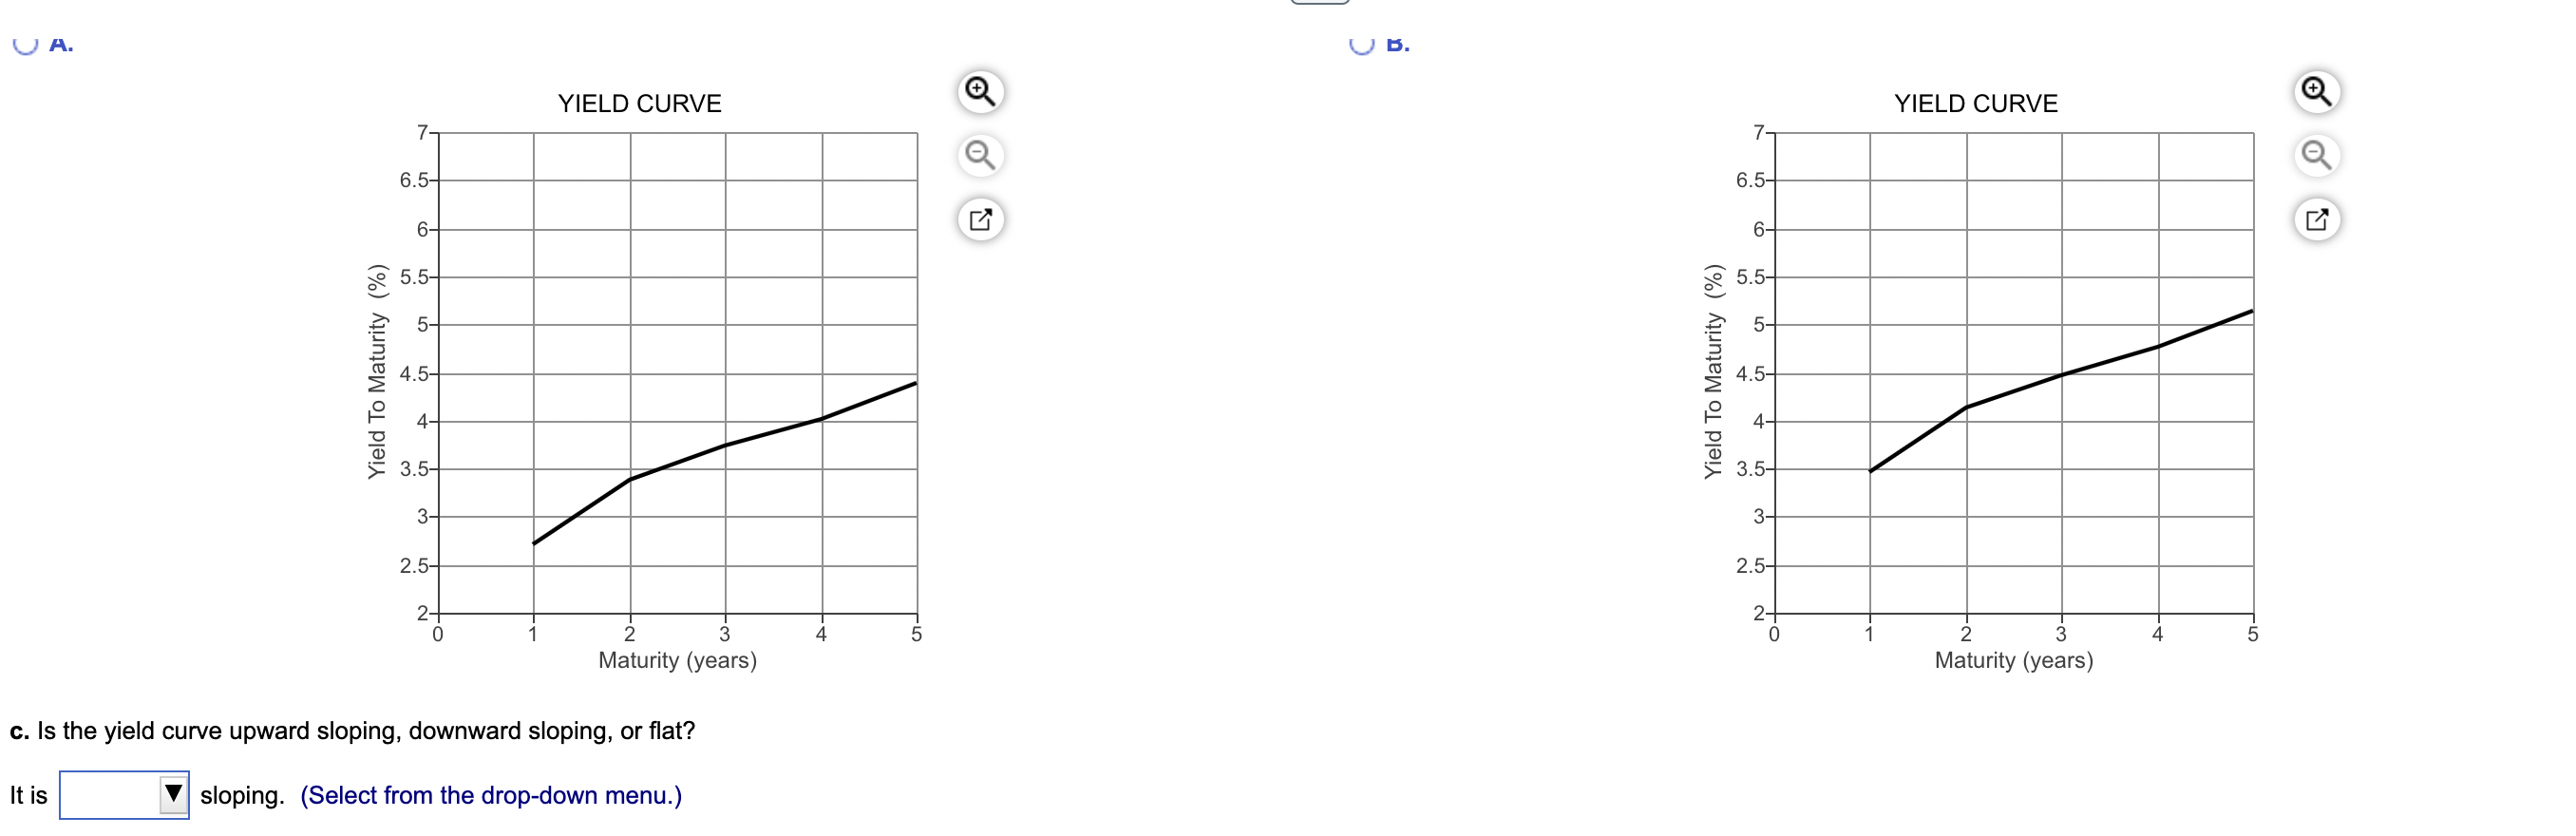
The following table summarizes prices of various default-free zero-coupon bonds ($100 face value): Maturity (years) Price (per S100 face value) 1 $96.65 2 $92.22 3 $87.67 4 $83.02 5 $77.84 a. Compute the yield to maturity for each bond. b. Plot the zero-coupon yield curve (for the first five years). c. Is the yield curve upward sloping, downward sloping, or flat? Note: Assume annual compounding, a. Compute the yield to maturity for each bond. The yield on the 1-year bond is %. (Round to two decimal places.) The yield on the 2-year bond is %. (Round to two decimal places.) The yleld on the 3-year bond is % (Round to two decimal places.) The yield on the 4-year bond is%. (Round to two decimal places.) The yield on the 5-year bond is % (Round to two decimal places.) b. Plot the zero-coupon yield curve (for the first five years). (Select the best choice below.) OA. . YIELD CURVE YIELD CURVE 6.5 6.5 51 A. UB. YIELD CURVE YIELD CURVE 7- 7- 79 6.5- 6.5- 6- 6- 5.5 5.5- 5- 5- Yield To Maturity (%) 4.5- Yield To Maturity (%) 4.5- 4- 4- 3.57 3.54 3- 3- 2.5- 2.5- 2- 0 2- 0 3 4. 5 2 3 4. 5 2 Maturity (years) Maturity (years) c. Is the yield curve upward sloping, downward sloping, or flat? It is sloping. (Select from the drop-down menu.)
Step by Step Solution
There are 3 Steps involved in it

Get step-by-step solutions from verified subject matter experts