

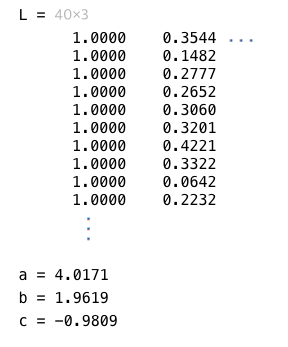
Question: These are the data points. Language: Matlab L = 40x3 1.0000 1.0000 1.0000 1.0000 1.0000 1.0000 1.0000 1.0000 1.0000 1.0000 0.3544 0.1482 0.2777 0.2652 0.3060
These are the data points. Language: Matlab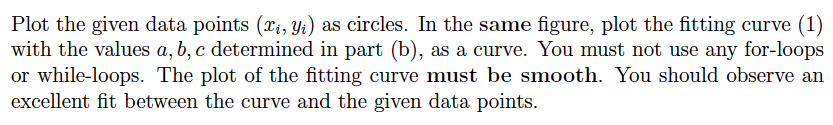
L = 40x3 1.0000 1.0000 1.0000 1.0000 1.0000 1.0000 1.0000 1.0000 1.0000 1.0000 0.3544 0.1482 0.2777 0.2652 0.3060 0.3201 0.4221 0.3322 0.0642 0.2232 a = 4.0171 b = 1.9619 C = -0.9809 Plot the given data points (li, yi) as circles. In the same figure, plot the fitting curve (1) with the values a,b,c determined in part (b), as a curve. You must not use any for-loops or while-loops. The plot of the fitting curve must be smooth. You should observe an excellent fit between the curve and the given data points. L = 40x3 1.0000 1.0000 1.0000 1.0000 1.0000 1.0000 1.0000 1.0000 1.0000 1.0000 0.3544 0.1482 0.2777 0.2652 0.3060 0.3201 0.4221 0.3322 0.0642 0.2232 a = 4.0171 b = 1.9619 C = -0.9809 Plot the given data points (li, yi) as circles. In the same figure, plot the fitting curve (1) with the values a,b,c determined in part (b), as a curve. You must not use any for-loops or while-loops. The plot of the fitting curve must be smooth. You should observe an excellent fit between the curve and the given data points
Step by Step Solution
There are 3 Steps involved in it

Get step-by-step solutions from verified subject matter experts