

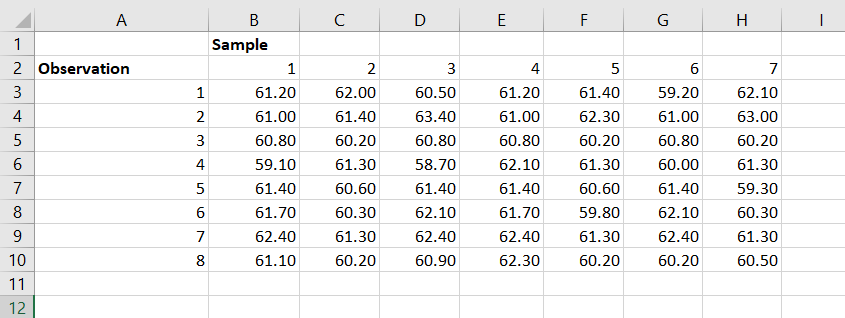
Question: These data represent seven samples (taken on seven sequential days) each containing eight bags of salt. The weights (in ounces) are shown. Create an X-bar
These data represent seven samples (taken on seven sequential days) each containing eight bags of salt. The weights (in ounces) are shown. Create an X-bar chart and an R-chart for the data provided. Comment on whether each chart indicates the process is in control or not. Please show all equations used for each cell.
Step by Step Solution
There are 3 Steps involved in it
1 Expert Approved Answer
Step: 1 Unlock

Question Has Been Solved by an Expert!
Get step-by-step solutions from verified subject matter experts
Step: 2 Unlock
Step: 3 Unlock