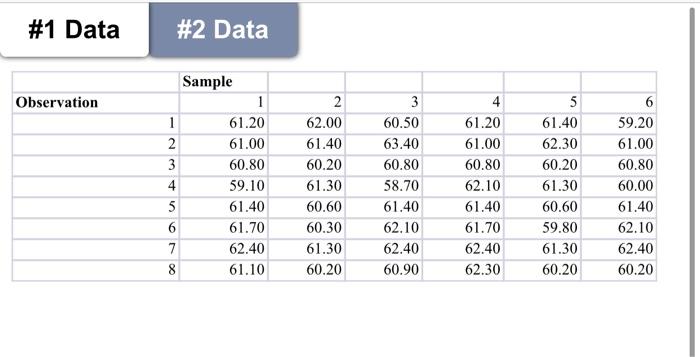
Question: 1. 20 points. Use the data in the Excel file (#1 Data). These data represent six samples (taken on six sequential days) each containing eight

1. 20 points. Use the data in the Excel file (#1
1. 20 points. Use the data in the Excel file (#1 Data). These data represent six samples (taken on six sequential days) each containing eight bags of salt. The weights (in ounces) are shown. Create an X-bar chart and an R-chart for the data provided. Comment on whether each chart indicates the process is in control or not. #1 Data #2 Data Observation 1 2 3 4 5 6 7 8 Sample 1 61.20 61.00 60.80 59.10 61.40 61.70 62.40 61.10 2 62.00 61.40 60.20 61.30 60.60 60.30 61.30 60.20 3 60.50 63.40 60.80 58.70 61.40 62.10 62.40 60.90 4 61.20 61.00 60.80 62.10 61.40 61.70 62.40 62.30 5 61.40 62.30 60.20 61.30 60.60 59.80 61.30 60.20 6 59.20 61.00 60.80 60.00 61.40 62.10 62.40 60.20

Step by Step Solution

There are 3 Steps involved in it

1 Expert Approved Answer
Step: 1 Unlock blur-text-image
Question Has Been Solved by an Expert!

Get step-by-step solutions from verified subject matter experts

Step: 2 Unlock
Step: 3 Unlock

Students Have Also Explored These Related General Management Questions!