

Question: ------------- these equation to help you for solution Chapter 11 Queueing Theory Q-1: (M/M/1/ / FIFO) [30] A medical clinic has a single doctor. During
![Theory Q-1: (M/M/1/ / FIFO) [30] A medical clinic has a single](https://dsd5zvtm8ll6.cloudfront.net/si.experts.images/questions/2024/09/66f7f5530d641_22666f7f5528bc5d.jpg)
-------------
these equation to help you for solution
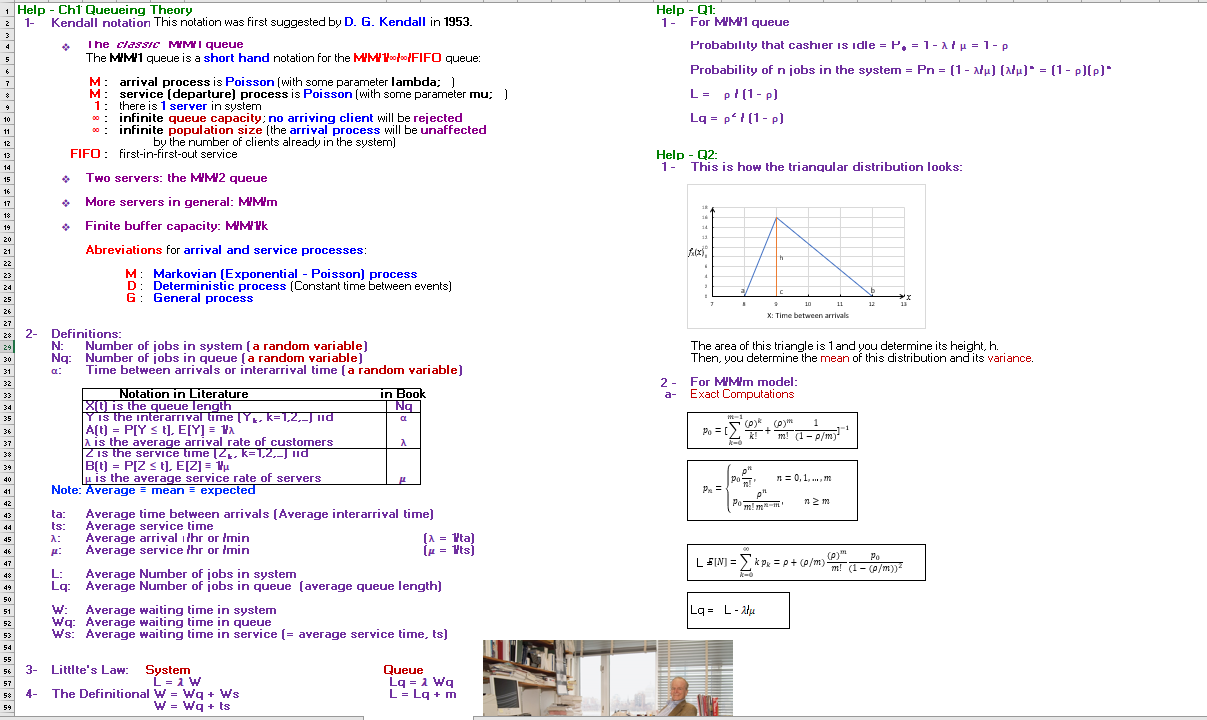
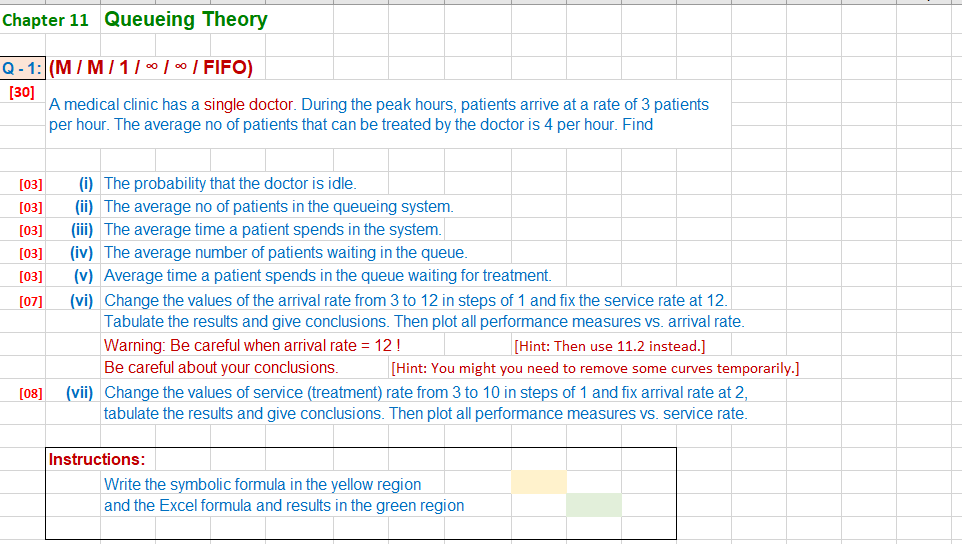
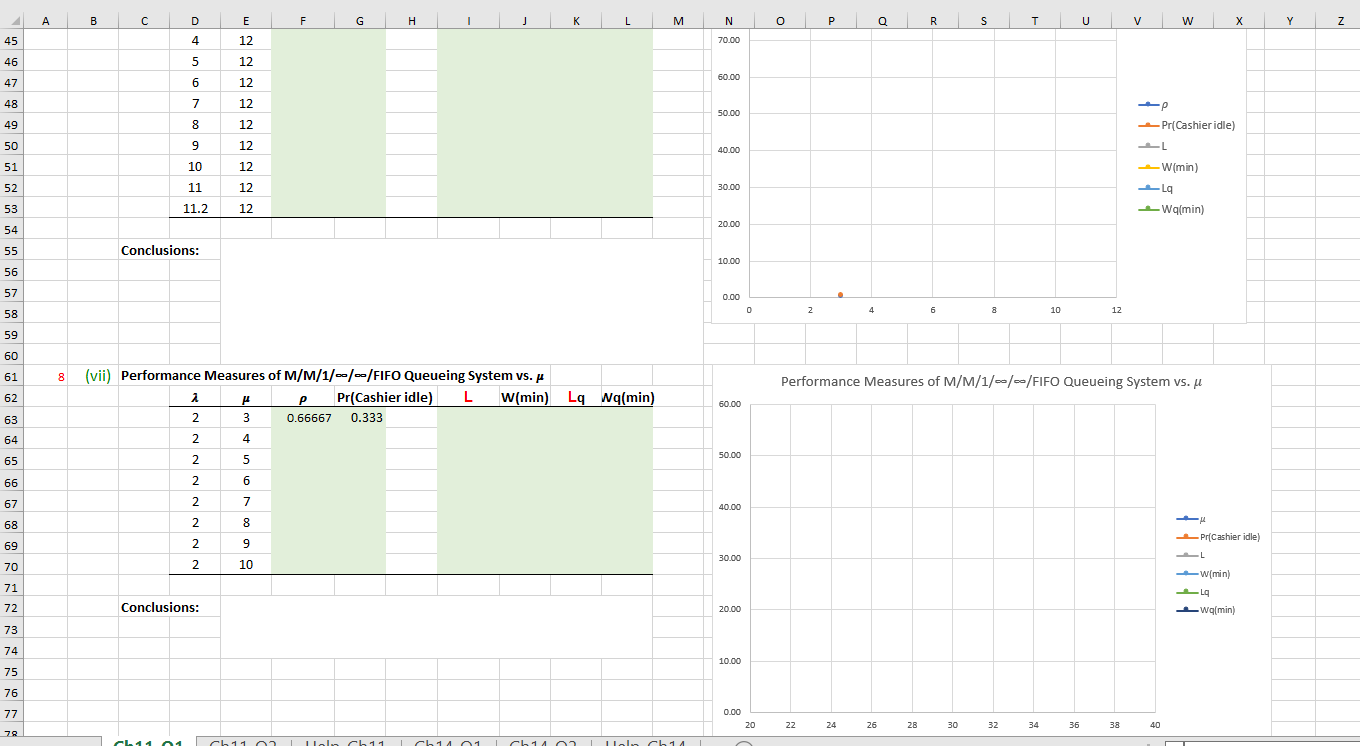
Chapter 11 Queueing Theory Q-1: (M/M/1/ / FIFO) [30] A medical clinic has a single doctor. During the peak hours, patients arrive at a rate of 3 patients per hour. The average no of patients that can be treated by the doctor is 4 per hour. Find [03] [03] [03] [03] [03] [07] (i) The probability that the doctor is idle. (ii) The average no of patients in the queueing system. (iii) The average time a patient spends in the system. (iv) The average number of patients waiting in the queue. (v) Average time a patient spends in the queue waiting for treatment. (vi) Change the values of the arrival rate from 3 to 12 in steps of 1 and fix the service rate at 12. Tabulate the results and give conclusions. Then plot all performance measures vs. arrival rate. Warning: Be careful when arrival rate = 12! [Hint: Then use 11.2 instead.] Be careful about your conclusions. [Hint: You might you need to remove some curves temporarily.] (vii) Change the values of service treatment) rate from 3 to 10 in steps of 1 and fix arrival rate at 2, tabulate the results and give conclusions. Then plot all performance measures vs. service rate. [08] Instructions: Write the symbolic formula in the yellow region and the Excel formula and results in the green region A B D E F G H J K L M N O Q R S S T U V w X 25 Q-1: 26 2= patients/hr u= patients/hr 27 28 3 (i) Probability that doctor is idle = 29 30 31 3 (ii) Average number of patients in the system = 32 33 34 3 (iii) Average time a patient spends in the system = hrs = 0 min 35 36 37 3 (iv) Average number of patients waiting in the queue = 38 39 40 3 (v) Average time a patient spends in the queue = hrs = 0.00 min 41 Performance Measures of M/M/1/--/--/FIFO Queueing System vs. 2 42 7 43 (vi) Performance Measures of M/M/1/--/--/FIFO Queueing System vs. i 2 P Pr(Cashier idle) L W(min) LqWq(min) 3 0.25000 0.750 2 80.00 44 3 12 45 4 12 70.00 46 5 12 60.00 47 6 12 48 7 12 50.00 49 8 12 p m 42 43 44 45 L SIN] = " * px = 0+ (0/m) m! (1 - /m)) p+(m) 46 47 48 49 50 PO La - L-lue 51 52 53 54 55 56 57 58 59 3- Littlte's Law: System L-iW 4- The Definitional W = Wq+ Ws W = Watts Queue Lq:1 Wa L = Lq + m Chapter 11 Queueing Theory Q-1: (M/M/1/ / FIFO) [30] A medical clinic has a single doctor. During the peak hours, patients arrive at a rate of 3 patients per hour. The average no of patients that can be treated by the doctor is 4 per hour. Find [03] [03] [03] [03] [03] [07] (i) The probability that the doctor is idle. (ii) The average no of patients in the queueing system. (iii) The average time a patient spends in the system. (iv) The average number of patients waiting in the queue. (v) Average time a patient spends in the queue waiting for treatment. (vi) Change the values of the arrival rate from 3 to 12 in steps of 1 and fix the service rate at 12. Tabulate the results and give conclusions. Then plot all performance measures vs. arrival rate. Warning: Be careful when arrival rate = 12! [Hint: Then use 11.2 instead.] Be careful about your conclusions. [Hint: You might you need to remove some curves temporarily.] (vii) Change the values of service treatment) rate from 3 to 10 in steps of 1 and fix arrival rate at 2, tabulate the results and give conclusions. Then plot all performance measures vs. service rate. [08] Instructions: Write the symbolic formula in the yellow region and the Excel formula and results in the green region A B D E F G H J K L M N O Q R S S T U V w X 25 Q-1: 26 2= patients/hr u= patients/hr 27 28 3 (i) Probability that doctor is idle = 29 30 31 3 (ii) Average number of patients in the system = 32 33 34 3 (iii) Average time a patient spends in the system = hrs = 0 min 35 36 37 3 (iv) Average number of patients waiting in the queue = 38 39 40 3 (v) Average time a patient spends in the queue = hrs = 0.00 min 41 Performance Measures of M/M/1/--/--/FIFO Queueing System vs. 2 42 7 43 (vi) Performance Measures of M/M/1/--/--/FIFO Queueing System vs. i 2 P Pr(Cashier idle) L W(min) LqWq(min) 3 0.25000 0.750 2 80.00 44 3 12 45 4 12 70.00 46 5 12 60.00 47 6 12 48 7 12 50.00 49 8 12 p m 42 43 44 45 L SIN] = " * px = 0+ (0/m) m! (1 - /m)) p+(m) 46 47 48 49 50 PO La - L-lue 51 52 53 54 55 56 57 58 59 3- Littlte's Law: System L-iW 4- The Definitional W = Wq+ Ws W = Watts Queue Lq:1 Wa L = Lq + m
Step by Step Solution
There are 3 Steps involved in it

Get step-by-step solutions from verified subject matter experts