

Question: These graph shows the Marginal Cost, Average Cost, and Average Variable Cost. Please compute all possible cells. Show how you calculate your figures for the
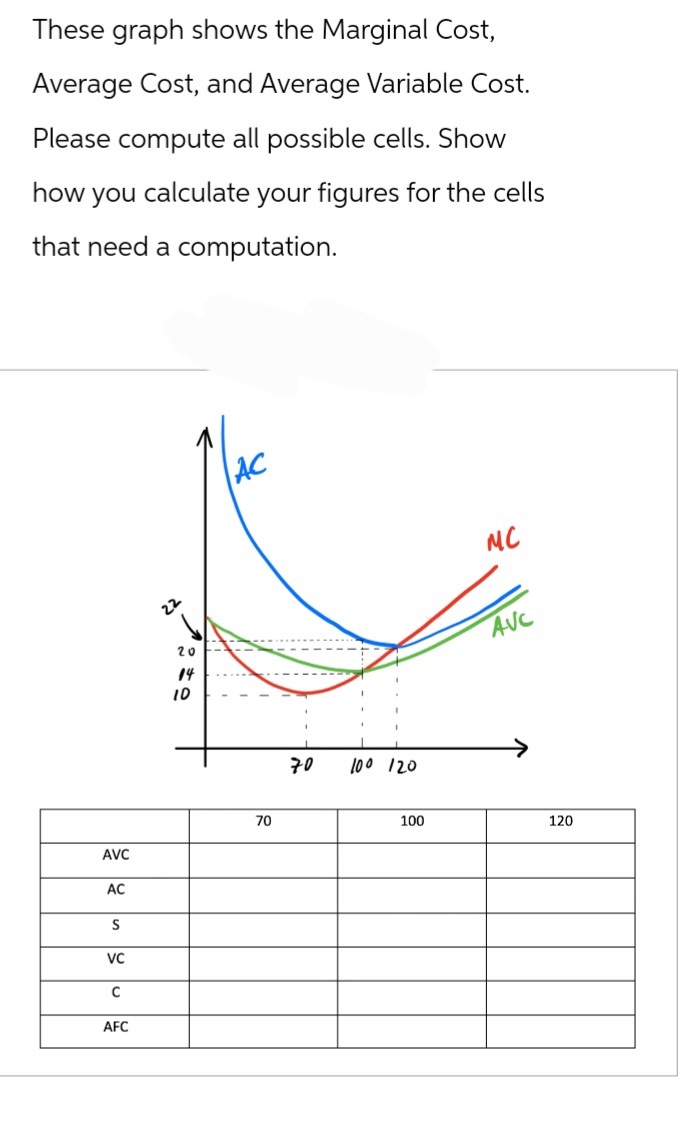

These graph shows the Marginal Cost, Average Cost, and Average Variable Cost. Please compute all possible cells. Show how you calculate your figures for the cells that need a computation
Step by Step Solution
There are 3 Steps involved in it
1 Expert Approved Answer
Step: 1 Unlock

Question Has Been Solved by an Expert!
Get step-by-step solutions from verified subject matter experts
Step: 2 Unlock
Step: 3 Unlock