

Question: These three charts give us insight into these changes. In no less than 200 words, describe the U.S. trends in relation to the epochs of
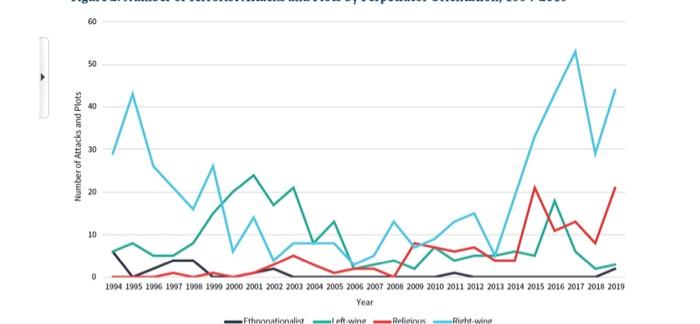
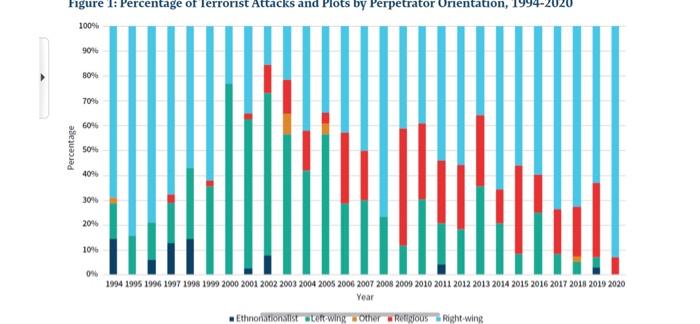
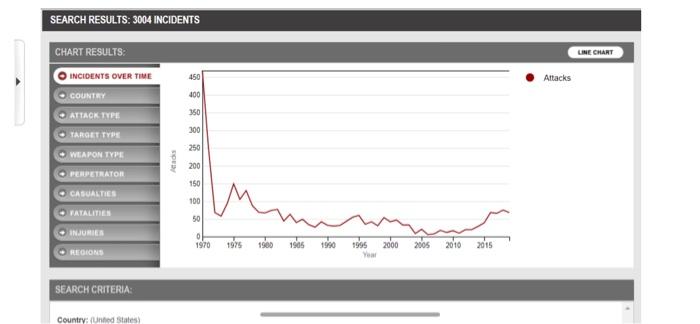
These three charts give us insight into these changes. In no less than 200 words, describe the U.S. trends in relation to the epochs of terrorism as depicted in the below charts. 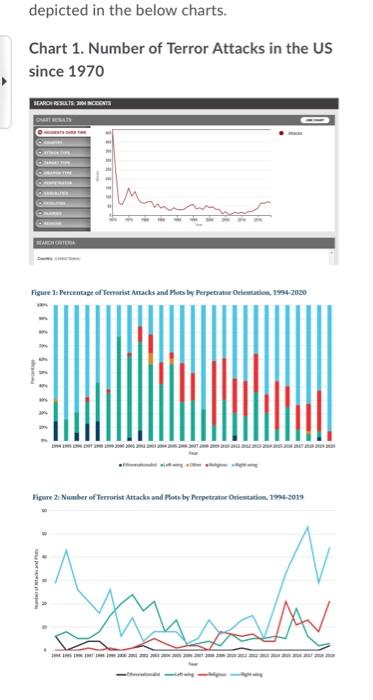
Step by Step Solution
There are 3 Steps involved in it
1 Expert Approved Answer
Step: 1 Unlock

Question Has Been Solved by an Expert!
Get step-by-step solutions from verified subject matter experts
Step: 2 Unlock
Step: 3 Unlock