

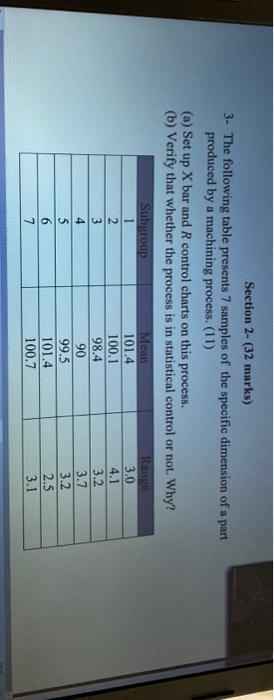
Question: third question is to be solved Section 2- (32 marks) 3. The following table presents 7 samples of the specific dimension of a part produced
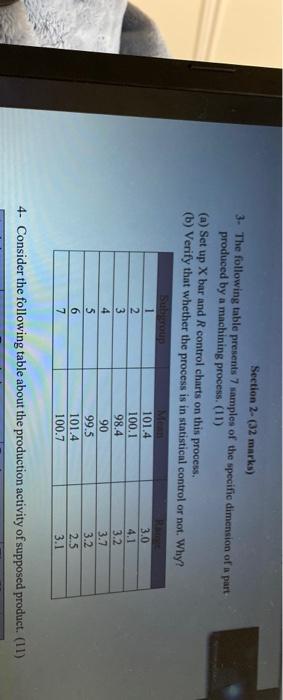
third question is to be solved
Step by Step Solution
There are 3 Steps involved in it
1 Expert Approved Answer
Step: 1 Unlock

Question Has Been Solved by an Expert!
Get step-by-step solutions from verified subject matter experts
Step: 2 Unlock
Step: 3 Unlock