

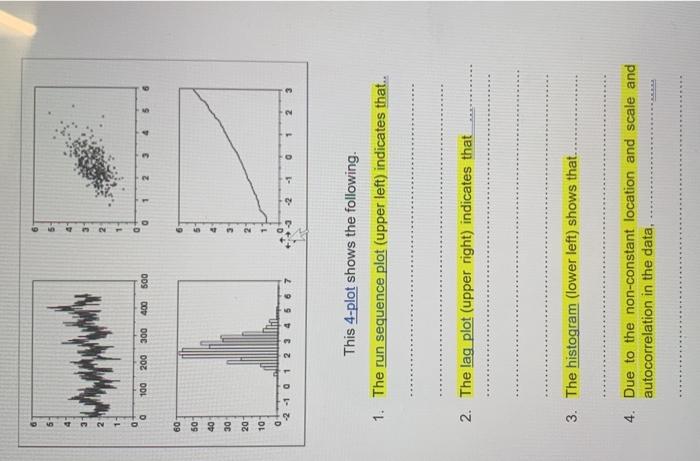
Question: This 4-plot shows the following. 1. The run sequence plot (upper left) indicates that.. 2. The lag plot (upper right) indicates that 3. The histogram
Step by Step Solution
There are 3 Steps involved in it
1 Expert Approved Answer
Step: 1 Unlock

Question Has Been Solved by an Expert!
Get step-by-step solutions from verified subject matter experts
Step: 2 Unlock
Step: 3 Unlock