

Question: this analysis. Descriptive Statistics: Fat Smoke N Mean StDev SE Mean No 272 75 . 9 33 . 7 2.0 Yes 43 84.3 34.1 5.
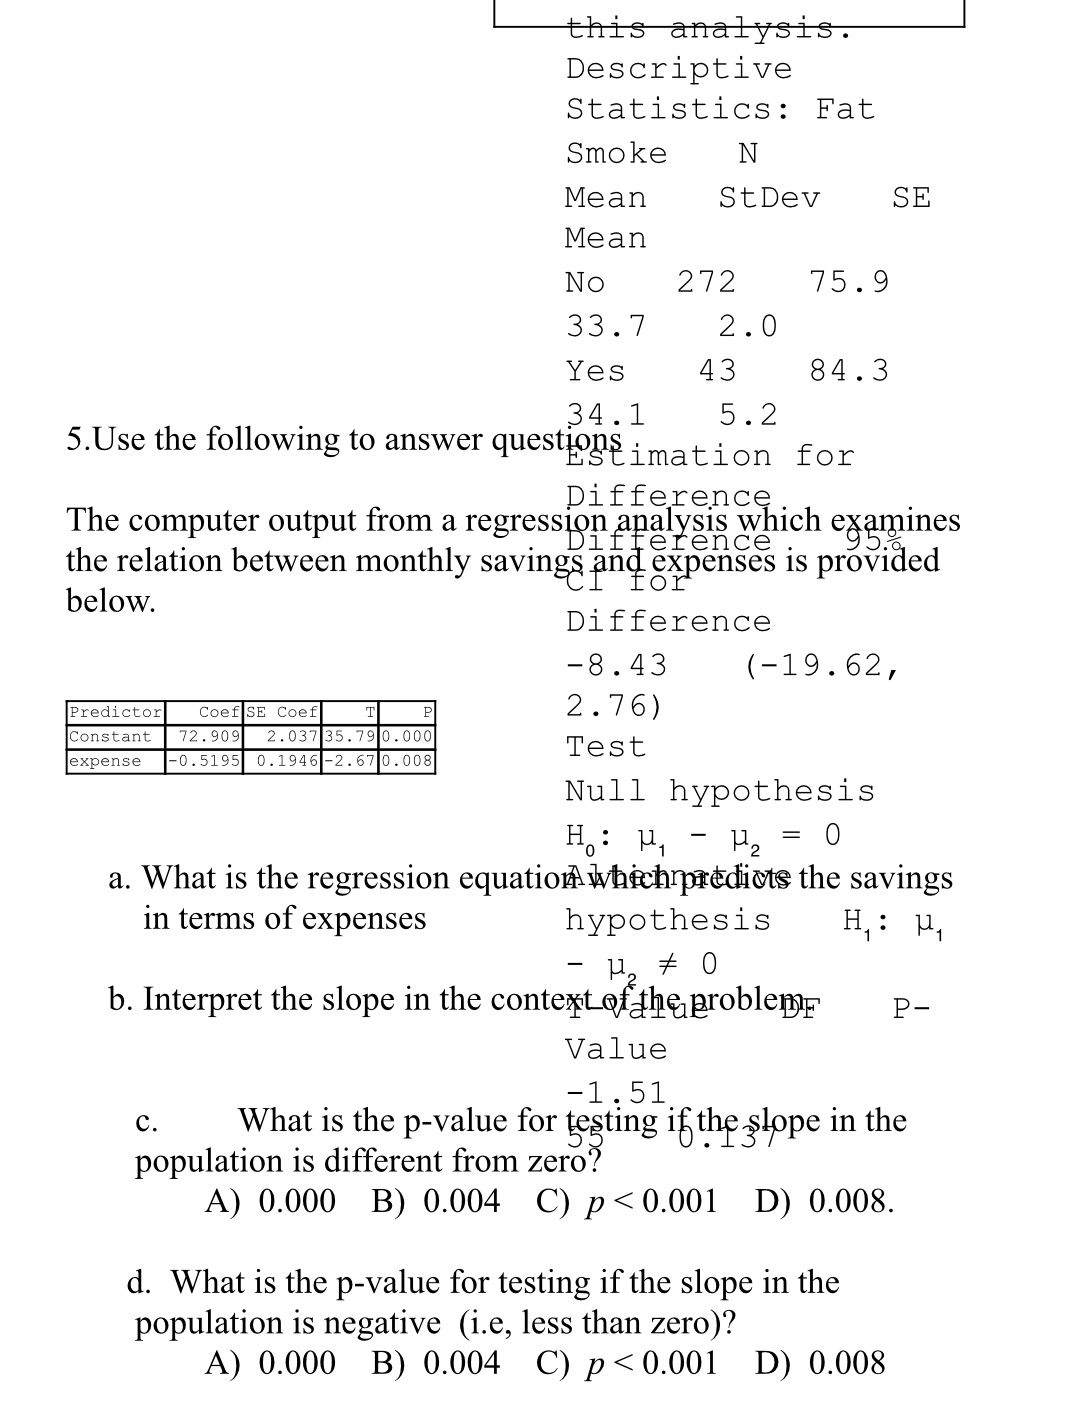
this analysis. Descriptive Statistics: Fat Smoke N Mean StDev SE Mean No 272 75 . 9 33 . 7 2.0 Yes 43 84.3 34.1 5. 2 5. Use the following to answer questions imation for Difference The computer output from a regression analysis which examines the relation between monthly savings and expenses is provided below. Difference -8 . 43 (-19. 62, Predictor Coef SE Coef T 2. 76) Constant 72.909 2. 037 35. 790.000 expense -0 . 5195 0 . 1946 -2. 67 0. 008 Test Null hypothesis H: M , - H 2 = 0 a. What is the regression equation which predicts the savings in terms of expenses hypothesis H : M , - H, * 0 b. Interpret the slope in the context of the problem P- Value -1. 51 C. What is the p-value for testing if the slope in the population is different from zero? A) 0.000 B) 0.004 C) p
Step by Step Solution
There are 3 Steps involved in it

Get step-by-step solutions from verified subject matter experts