

Question: This as much of the assignment that I could get in if you need more maybe once you look at the top half you can
This as much of the assignment that I could get in if you need more maybe once you look at the top half you can see where it's going into the table .after what you have on the paper the last free numbers are I'll put r for right hand side and l for left hand side .r =28.0,24.5,29.5,37.7,26.8,23.9, and l=25.7,29.9,27.5,27.6,23.0,30.7,29.0, that all the information
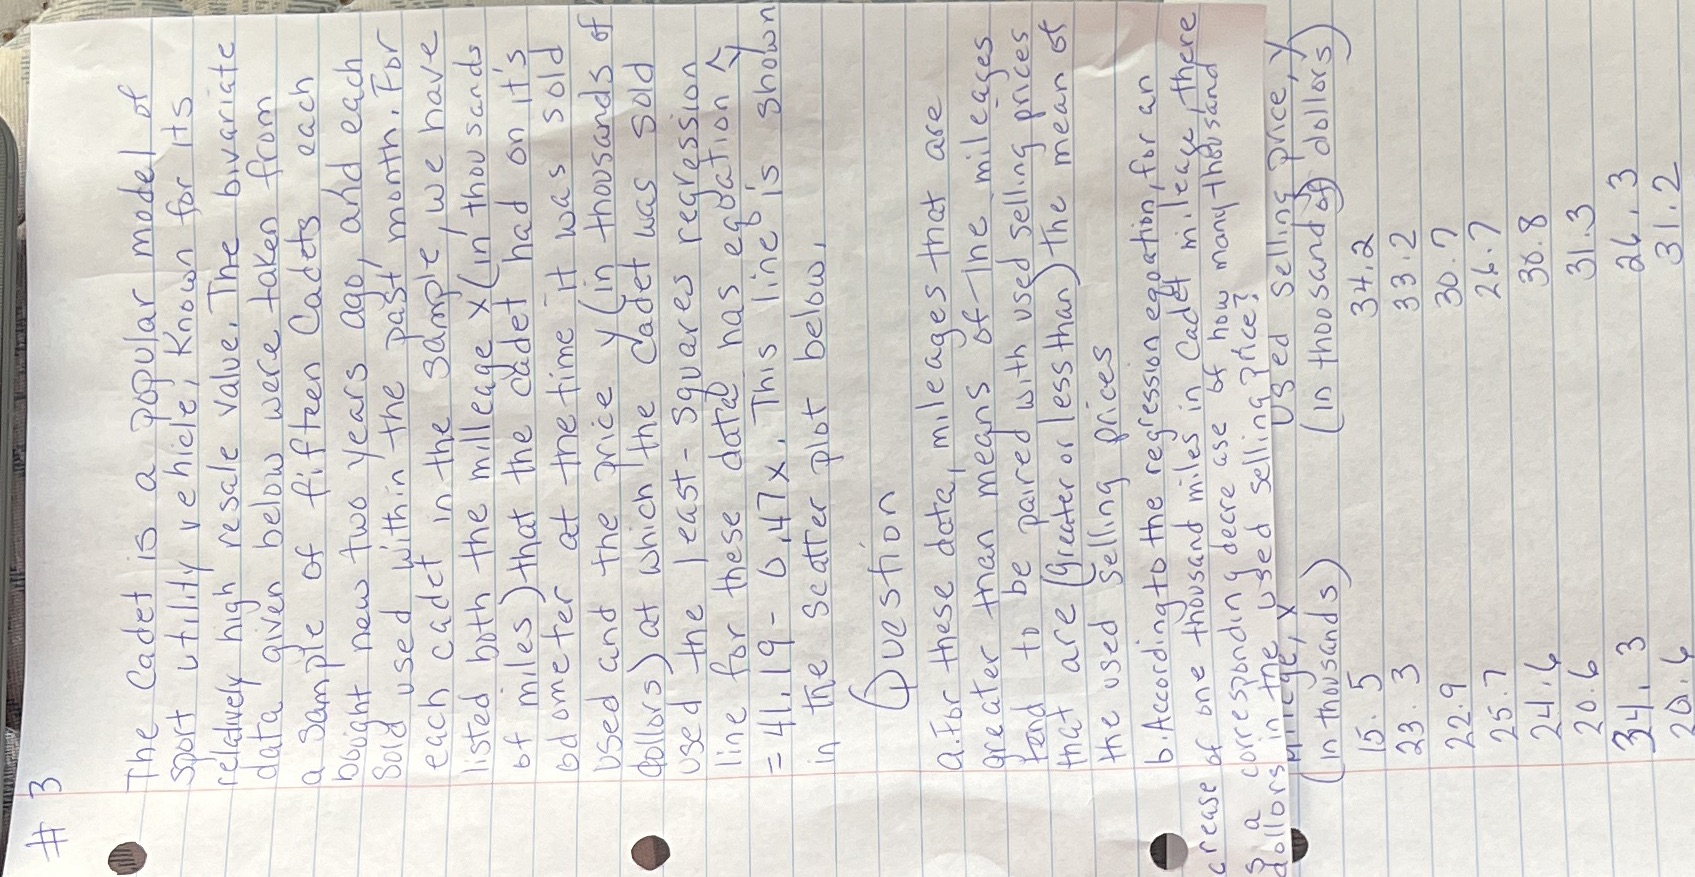
# B The Cadet is a popular model of sport utility vehicle, Known for its relatively high resale value , The bivariate data given below were taken from a Sample of fifteen Cadets each bought new two years ago, and each Sold used within the past month , For each cadet in the sample , we have listed both the milleage x ( in thousands of miles ) that the cadet had on it's odometer at the time it was sold used and the price y ( in thousands of collors ) at which the cadet was sold used the least - squares regression line for these date has equation = 41, 19 - 0, 47 x, This line is shown in the scatter plot below, Question a . For these data , mileages that are greater than means of ine mileages tend to be paired with used selling prices that are ( greater or less than ) the mean of the used selling prices b. According to the regression equation, for an crease of one thousand miles in Cadet mileage, there a corresponding decrease of how many thousand follors in the used selling prices Used Selling price, y ( in thousands ) ( in thousand of) dollars 15. 5 34, 2 23. 3 33. 2 22.9 30.7 25.7 26.7 24. 6 30.8 20.6 31.3 34, 3 26 , 3 20. 4 31 . 2
Step by Step Solution
There are 3 Steps involved in it

Get step-by-step solutions from verified subject matter experts