

Question: This assignment is based on the lectures titled Sampling Logic, Descriptive Analysis, Inferential Data Analysis and Bayesian Inference. The purpose is to take you through
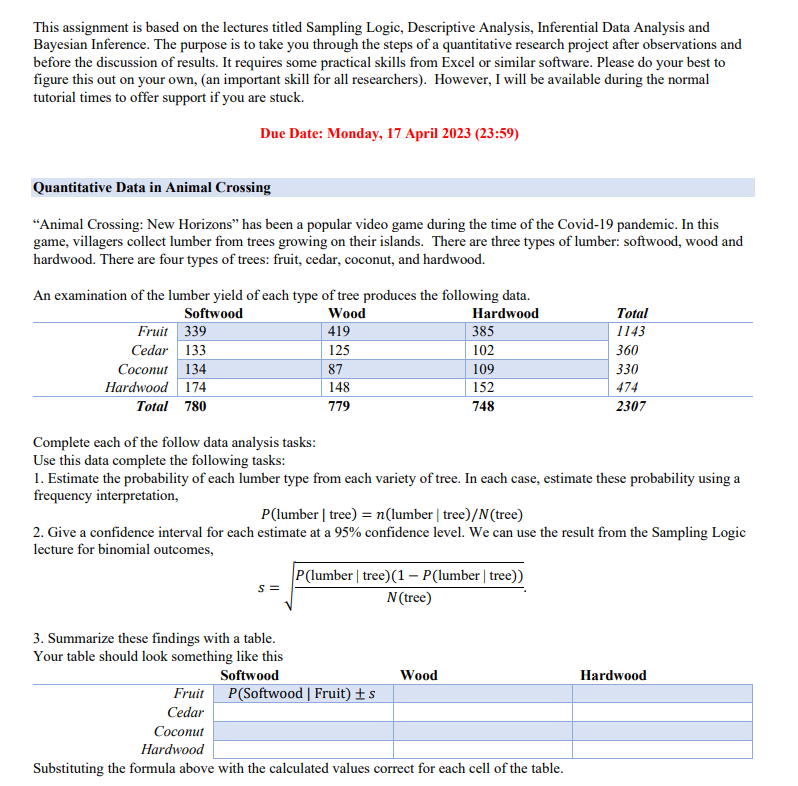
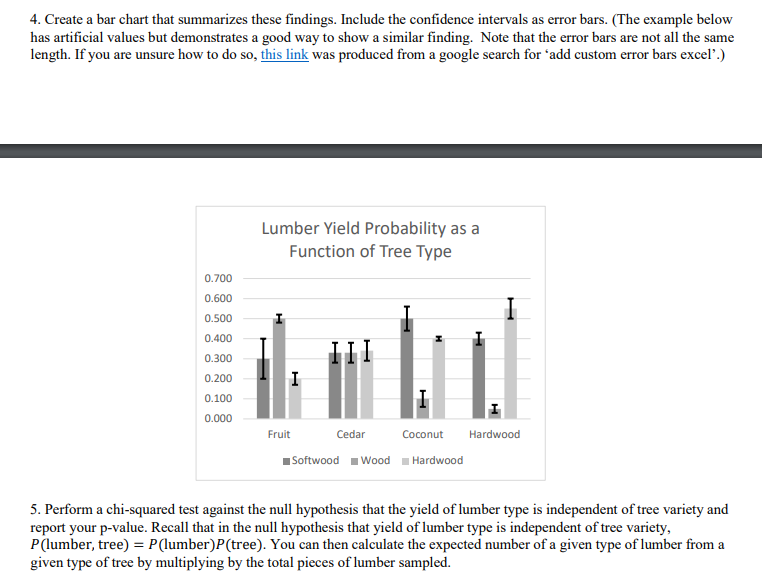
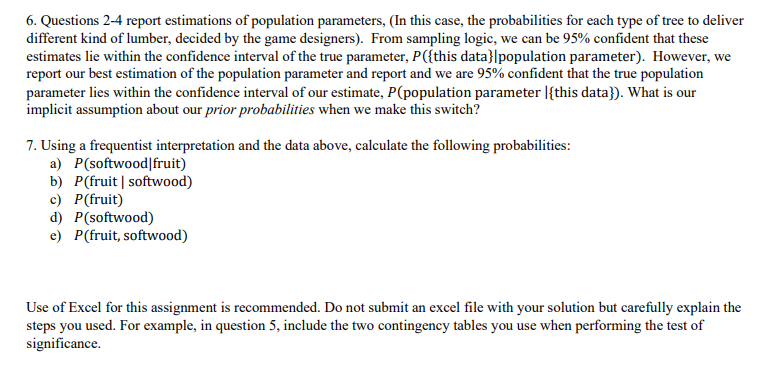
This assignment is based on the lectures titled Sampling Logic, Descriptive Analysis, Inferential Data Analysis and Bayesian Inference. The purpose is to take you through the steps of a quantitative research project after observations and before the discussion of results. It requires some practical skills from Excel or similar software. Please do your best to figure this out on your own, (an important skill for all researchers). However, I will be available during the normal tutorial times to offer support if you are stuck. Due Date: Monday, 17 April 2023 (23:59) Quantitative Data in Animal Crossing "Animal Crossing: New Horizons" has been a popular video game during the time of the Covid-19 pandemic. In this game, villagers collect lumber from trees growing on their islands. There are three types of lumber: softwood, wood and hardwood. There are four types of trees: fruit, cedar, coconut, and hardwood. An examination of the lumber yield of each type of tree produces the following data. Softwood Wood Hardwood Total Fruit 339 419 385 1143 Cedar 133 125 102 360 Coconut 134 87 109 330 Hardwood 174 148 152 474 Total 780 779 748 2307 Complete each of the follow data analysis tasks: Use this data complete the following tasks: I. Estimate the probability of each lumber type from each variety of tree. In each case, estimate these probability using a frequency interpretation, P(lumber | tree) = n(lumber | tree)/N (tree) 2. Give a confidence interval for each estimate at a 95% confidence level. We can use the result from the Sampling Logic lecture for binomial outcomes, P(lumber | tree) (1 - P(lumber | tree)) N (tree) 3. Summarize these findings with a table. Your table should look something like this Softwood Wood Hardwood Fruit P(Softwood | Fruit) + s Cedar Coconut Hardwood Substituting the formula above with the calculated values correct for each cell of the table.4. Create a bar chart that summarizes these findings. Include the confidence intervals as error bars. (The example below has artificial values but demonstrates a good way to show a similar finding. Note that the error bars are not all the same length. If you are unsure how to do so, this link was produced from a google search for 'add custom error bars excel'.) Lumber Yield Probability as a Function of Tree Type 0.700 0.600 0.500 0.400 0.300 III 0.200 H 0.100 0.000 Fruit Cedar Coconut Hardwood Softwood Wood _ Hardwood 5. Perform a chi-squared test against the null hypothesis that the yield of lumber type is independent of tree variety and report your p-value. Recall that in the null hypothesis that yield of lumber type is independent of tree variety, P(lumber, tree) = P(lumber)P(tree). You can then calculate the expected number of a given type of lumber from a given type of tree by multiplying by the total pieces of lumber sampled.6. Questions 2-4 report estimations of population parameters, (In this case, the probabilities for each type of tree to deliver different kind of lumber, decided by the game designers). From sampling logic, we can be 95% confident that these estimates lie within the confidence interval of the true parameter, P({this data) |population parameter). However, we report our best estimation of the population parameter and report and we are 95% confident that the true population parameter lies within the confidence interval of our estimate, P(population parameter | {this data}). What is our implicit assumption about our prior probabilities when we make this switch? 7. Using a frequentist interpretation and the data above, calculate the following probabilities: a) P(softwood fruit) b) P(fruit | softwood) P(fruit) P(softwood) e) P(fruit, softwood) Use of Excel for this assignment is recommended. Do not submit an excel file with your solution but carefully explain the steps you used. For example, in question 5, include the two contingency tables you use when performing the test of significance
Step by Step Solution
There are 3 Steps involved in it

Get step-by-step solutions from verified subject matter experts