

Question: This assignment is to be done in Excel. You are interested in forming a portfolio with Stock S and Bond B. Stock S has an
This assignment is to be done in Excel. You are interested in forming a portfolio with Stock S and Bond B. Stock S has an expected return of 14% and a standard deviation of returns of 30%. Bond B has an expected return of 8% and a standard deviation of returns of 15%. The correlation coefficient of the returns of S and B is 0.22. The risk-free rate of return is 5%. Using increments of 1 percentage point, fill in the template posted and plot both efficient frontiers (with vs. without the risk-free asset.) When plotting the line for the frontier with the risk-free asset, use a range from 0 to 30 for the X values. Please do not forget the important reminders below. 1. The weight in the bond (Wb) for the minimum-variance portfolio needs to be inserted numerically within the Wb column. 2. The weight in the bond (Wb) for the maximum-Sharpe-Ratio portfolio does not need to be inserted numerically in the Wb column, but you can do so if you would like.
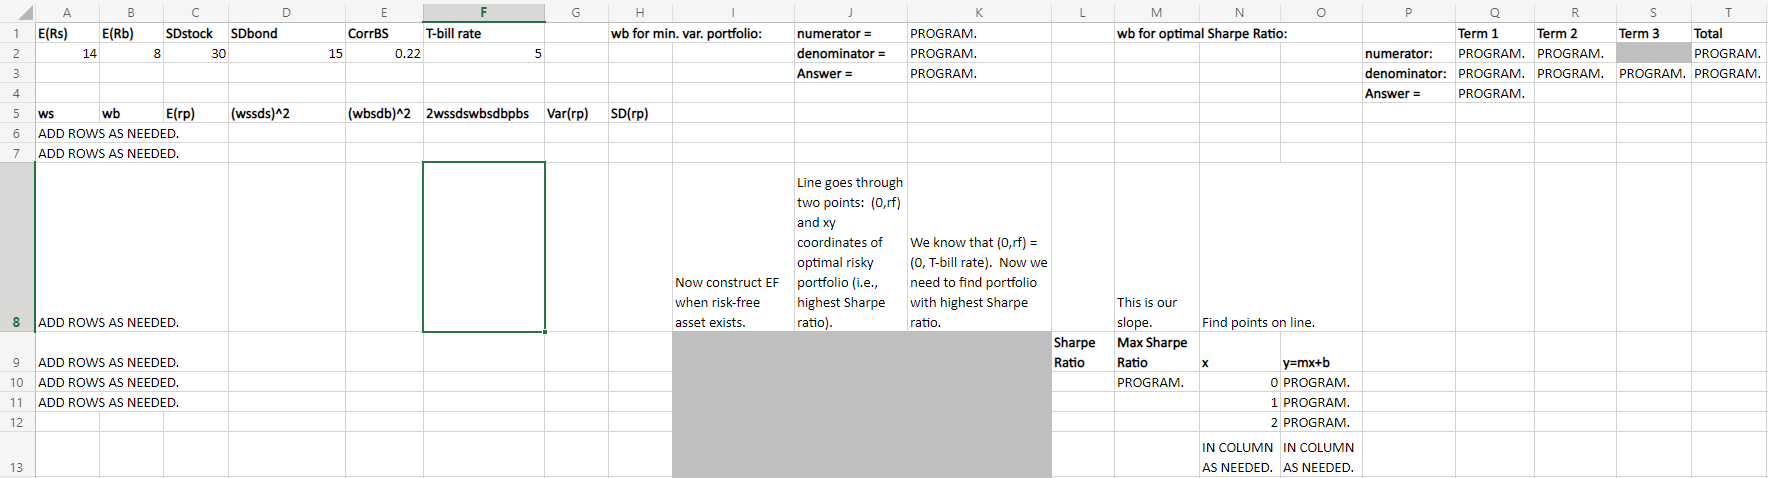
G H J K L O A 1 E(Rs) 2 B E(Rb) 14 D SDstock SDbond 8 30 E CorrBS 0.22 F T-bill rate M N wb for optimal Sharpe Ratio: wb for min. var. portfolio: 15 5 numerator = denominator = Answer = PROGRAM PROGRAM. PROGRAM. Q R S T Term 1 Term 2 Term 3 Total numerator: PROGRAM. PROGRAM. PROGRAM. denominator: PROGRAM. PROGRAM. PROGRAM. PROGRAM. Answer = PROGRAM. 3 4 5 (wssds)^2 (wbsdb)^2 2wssdswbsdbpbs Var(rp) SD(rp) 6 WS wb E(rp) ADD ROWS AS NEEDED. ADD ROWS AS NEEDED. 7 Line goes through two points: (0,rf) and xy coordinates of We know that (0,rf) = optimal risky (0, T-bill rate). Now we Now construct EF portfolio (i.e., need to find portfolio when risk-free highest Sharpe with highest Sharpe This is our asset exists. . ratio). ratio. slope. Sharpe Max Sharpe Ratio Ratio PROGRAM 8 ADD ROWS AS NEEDED. Find points on line. 9 ADD ROWS AS NEEDED. 10 ADD ROWS AS NEEDED. 11 ADD ROWS AS NEEDED. 12 y=mx+b O PROGRAM. 1 PROGRAM. 2 PROGRAM. IN COLUMN IN COLUMN AS NEEDED. AS NEEDED. 13 G H J K L O A 1 E(Rs) 2 B E(Rb) 14 D SDstock SDbond 8 30 E CorrBS 0.22 F T-bill rate M N wb for optimal Sharpe Ratio: wb for min. var. portfolio: 15 5 numerator = denominator = Answer = PROGRAM PROGRAM. PROGRAM. Q R S T Term 1 Term 2 Term 3 Total numerator: PROGRAM. PROGRAM. PROGRAM. denominator: PROGRAM. PROGRAM. PROGRAM. PROGRAM. Answer = PROGRAM. 3 4 5 (wssds)^2 (wbsdb)^2 2wssdswbsdbpbs Var(rp) SD(rp) 6 WS wb E(rp) ADD ROWS AS NEEDED. ADD ROWS AS NEEDED. 7 Line goes through two points: (0,rf) and xy coordinates of We know that (0,rf) = optimal risky (0, T-bill rate). Now we Now construct EF portfolio (i.e., need to find portfolio when risk-free highest Sharpe with highest Sharpe This is our asset exists. . ratio). ratio. slope. Sharpe Max Sharpe Ratio Ratio PROGRAM 8 ADD ROWS AS NEEDED. Find points on line. 9 ADD ROWS AS NEEDED. 10 ADD ROWS AS NEEDED. 11 ADD ROWS AS NEEDED. 12 y=mx+b O PROGRAM. 1 PROGRAM. 2 PROGRAM. IN COLUMN IN COLUMN AS NEEDED. AS NEEDED. 13
Step by Step Solution
There are 3 Steps involved in it

Get step-by-step solutions from verified subject matter experts