

Question: 7. Calculating a beta coefficient for a portfolio Kitsch General is a public company, and General Fund is a relatively well-diversified mutual fund. The following
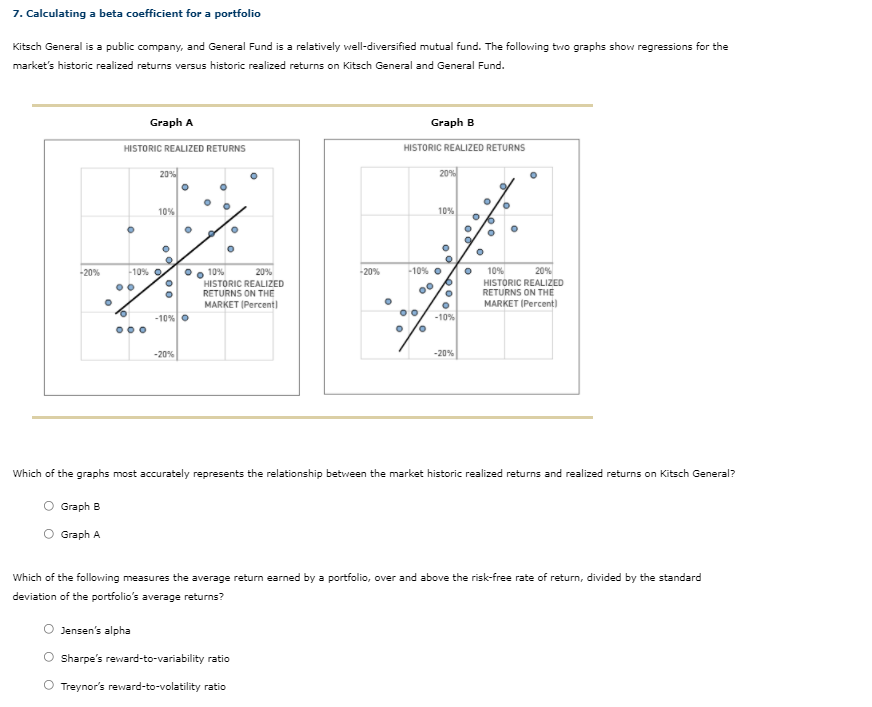
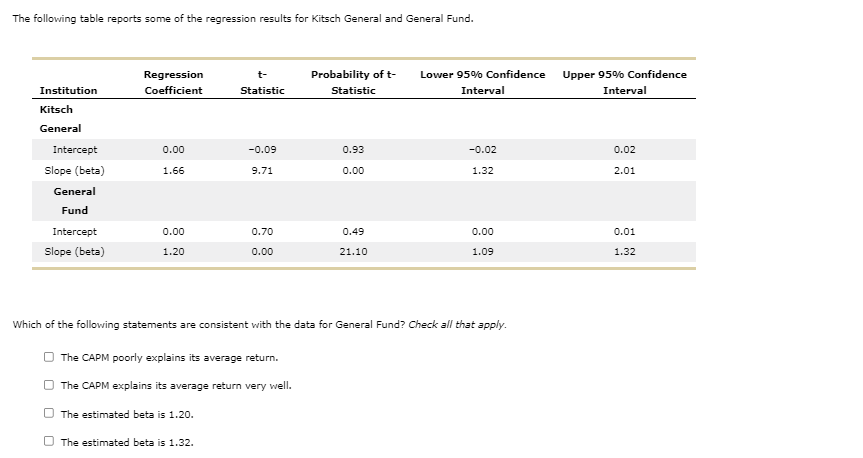
7. Calculating a beta coefficient for a portfolio Kitsch General is a public company, and General Fund is a relatively well-diversified mutual fund. The following two graphs show regressions for the market's historic realized returns versus historic realized returns on Kitsch General and General Fund. Graph A Graph B HISTORIC REALIZED RETURNS HISTORIC REALIZED RETURNS 20% 20% O 0 o 0 10% 10% O O o oo o -20% -10% -20% -10% O 20% o Oo 10% 20% HISTORIC REALIZED RETURNS ON THE MARKET (Percenti . 10% HISTORIC REALIZED RETURNS ON THE MARKET (Percent) O o -10% O -10% O -20% -20% Which of the graphs most accurately represents the relationship between the market historic realized returns and realized returns on Kitsch General? Graph B Graph A Which of the following measures the average return earned by a portfolio, over and above the risk-free rate of return, divided by the standard deviation of the portfolio's average returns? Jensen's alpha Sharpe's reward-to-variability ratio Treynor's reward-to-volatility ratio The following table reports some of the regression results for Kitsch General and General Fund. Regression Coefficient t- Statistic Probability of t- Statistic Lower 95% Confidence Interval Upper 95% Confidence Interval Institution 0.00 -0.09 0.93 -0.02 0.02 Kitsch General Intercept Slope (beta) General Fund 1.66 9.71 0.00 1.32 2.01 0.00 0.70 0.49 0.00 0.0 Intercept Slope (beta) 1.20 0.00 21.10 1.09 1.32 Which of the following statements are consistent with the data for General Fund? Check all that apply. The CAPM poorly explains its average return. The CAPM explains its average return very well. The estimated beta is 1.20. The estimated beta is 1.32. 7. Calculating a beta coefficient for a portfolio Kitsch General is a public company, and General Fund is a relatively well-diversified mutual fund. The following two graphs show regressions for the market's historic realized returns versus historic realized returns on Kitsch General and General Fund. Graph A Graph B HISTORIC REALIZED RETURNS HISTORIC REALIZED RETURNS 20% 20% O 0 o 0 10% 10% O O o oo o -20% -10% -20% -10% O 20% o Oo 10% 20% HISTORIC REALIZED RETURNS ON THE MARKET (Percenti . 10% HISTORIC REALIZED RETURNS ON THE MARKET (Percent) O o -10% O -10% O -20% -20% Which of the graphs most accurately represents the relationship between the market historic realized returns and realized returns on Kitsch General? Graph B Graph A Which of the following measures the average return earned by a portfolio, over and above the risk-free rate of return, divided by the standard deviation of the portfolio's average returns? Jensen's alpha Sharpe's reward-to-variability ratio Treynor's reward-to-volatility ratio The following table reports some of the regression results for Kitsch General and General Fund. Regression Coefficient t- Statistic Probability of t- Statistic Lower 95% Confidence Interval Upper 95% Confidence Interval Institution 0.00 -0.09 0.93 -0.02 0.02 Kitsch General Intercept Slope (beta) General Fund 1.66 9.71 0.00 1.32 2.01 0.00 0.70 0.49 0.00 0.0 Intercept Slope (beta) 1.20 0.00 21.10 1.09 1.32 Which of the following statements are consistent with the data for General Fund? Check all that apply. The CAPM poorly explains its average return. The CAPM explains its average return very well. The estimated beta is 1.20. The estimated beta is 1.32
Step by Step Solution
There are 3 Steps involved in it

Get step-by-step solutions from verified subject matter experts