

Question: This assignment requires you to construct a graph. You may do so digitally, using software such as Microsoft Excel or Desmos, or by hand using

This assignment requires you to construct a graph. You may do so digitally, using software such as Microsoft Excel or Desmos, or by hand using graph paper and pencil. No matter how you do the graph, you will be required to capture and insert it as an image into the assignment worksheet.
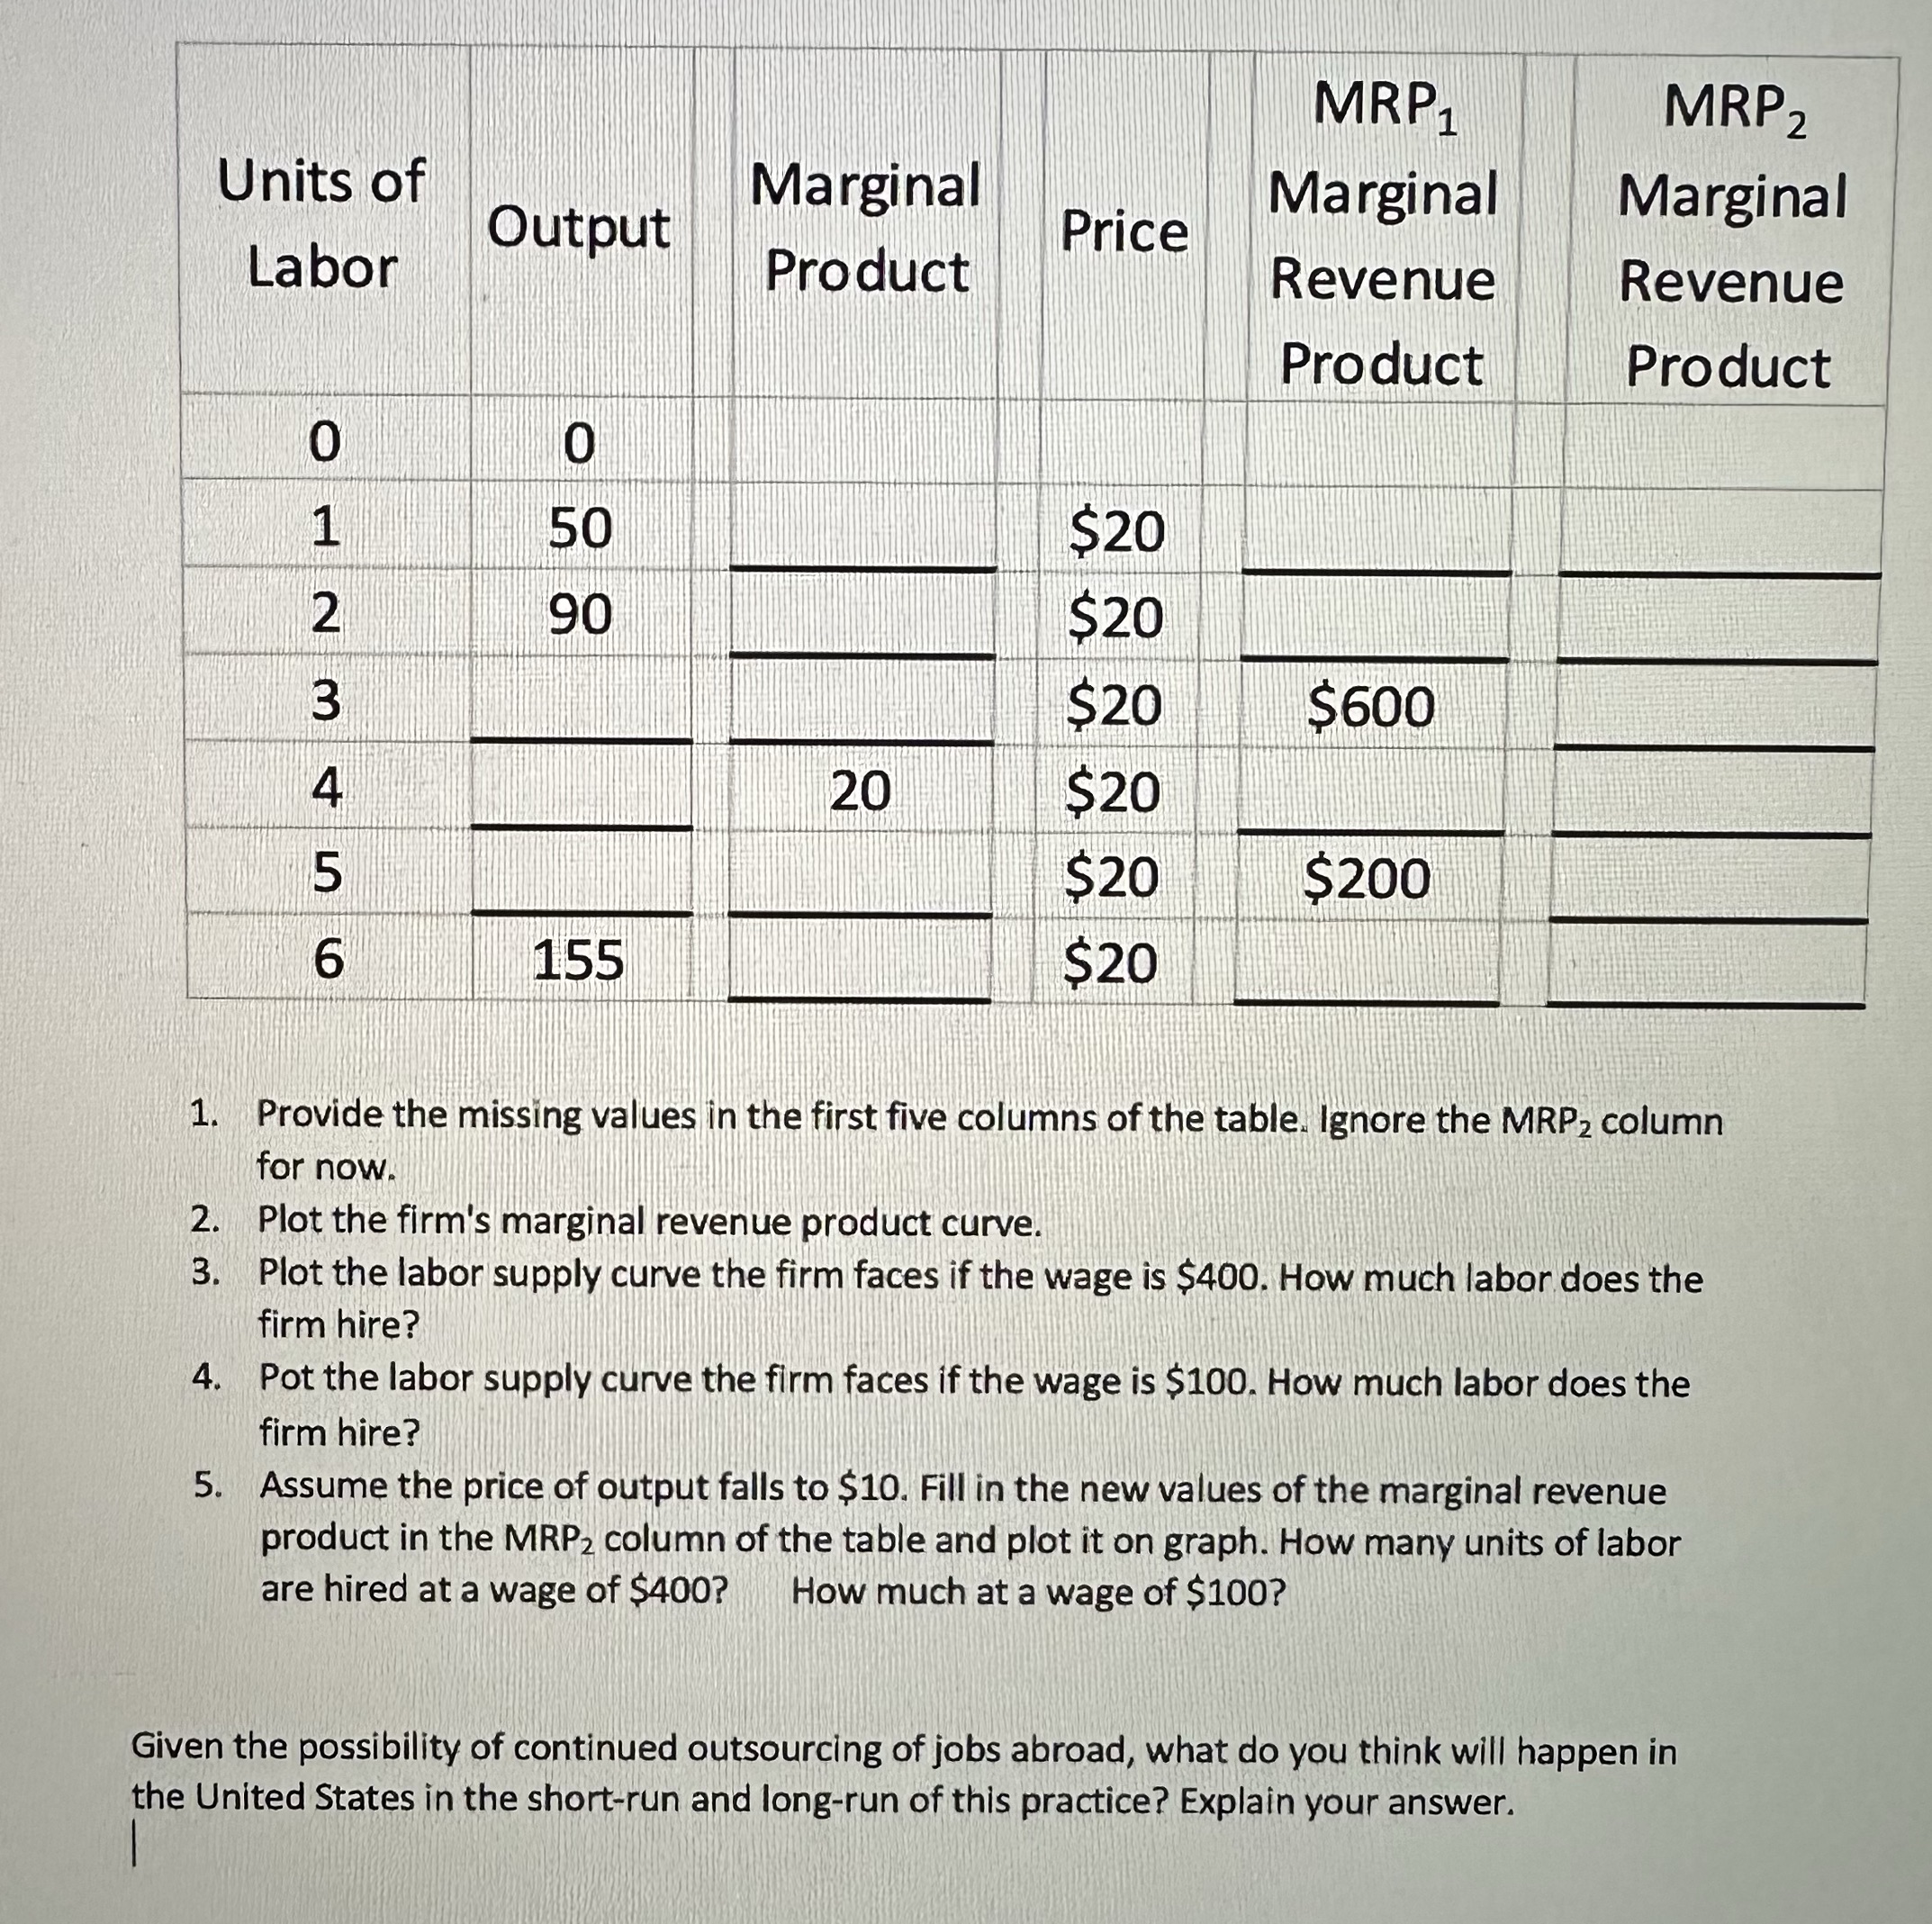
MRP1 MRP 2 Units of Marginal Marginal Marginal Output Price Labor Product Revenue Revenue Product Product 0 0 50 $20 90 $20 TAWNY $20 $600 20 $20 5 $20 $200 6 155 $20 1. Provide the missing values in the first five columns of the table. Ignore the MRP2 column for now. 2. Plot the firm's marginal revenue product curve. 3. Plot the labor supply curve the firm faces if the wage is $400. How much labor does the firm hire? 4. Pot the labor supply curve the firm faces if the wage is $100. How much labor does the firm hire? 5. Assume the price of output falls to $10. Fill in the new values of the marginal revenue product in the MRP2 column of the table and plot it on graph. How many units of labor are hired at a wage of $400? How much at a wage of $100? Given the possibility of continued outsourcing of jobs abroad, what do you think will happen in the United States in the short-run and long-run of this practice? Explain your
Step by Step Solution
There are 3 Steps involved in it

Get step-by-step solutions from verified subject matter experts