

Question: This assignment uses Arena Modeling simulator software. Exercise 4.21 A repair and inspection facility consists of two stations, a repair station with two technicians, and
This assignment uses Arena Modeling simulator software.
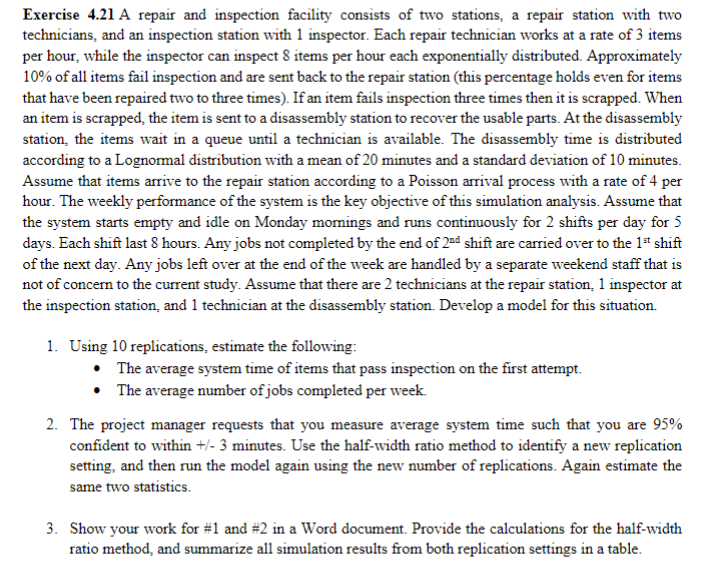
Exercise 4.21 A repair and inspection facility consists of two stations, a repair station with two technicians, and an inspection station with 1 inspector. Each repair technician works at a rate of 3 items per hour, while the inspector can inspect 8 items per hour each exponentially distributed. Approximately 10% of all items fail inspection and are sent back to the repair station (this percentage holds even for items that have been repaired two to three times). If an item fails inspection three times then it is scrapped. When an item is scrapped, the item is sent to a disassembly station to recover the usable parts. At the disassembly station, the items wait in a queue until a technician is available. The disassembly time is distributed according to a Lognormal distribution with a mean of 20 minutes and a standard deviation of 10 minutes. Assume that items arrive to the repair station according to a Poisson arrival process with a rate of 4 per hour. The weekly performance of the system is the key objective of this simulation analysis. Assume that the system starts empty and idle on Monday mornings and runs continuously for 2 shifts per day for 5 days. Each shift last 8 hours. Any jobs not completed by the end of 2nd shift are carried over to the 1st shift of the next day. Any jobs left over at the end of the week are handled by a separate weekend staff that is not of concern to the current study. Assume that there are 2 technicians at the repair station, 1 inspector at the inspection station, and 1 technician at the disassembly station. Develop a model for this situation. 1. Using 10 replications, estimate the following: - The average system time of items that pass inspection on the first attempt. - The average number of jobs completed per week. 2. The project manager requests that you measure average system time such that you are 95% confident to within +/3 minutes. Use the half-width ratio method to identify a new replication setting, and then run the model again using the new number of replications. Again estimate the same two statistics. 3. Show your work for #1 and #2 in a Word document. Provide the calculations for the half-width ratio method, and summarize all simulation results from both replication settings in a table
Step by Step Solution
There are 3 Steps involved in it

Get step-by-step solutions from verified subject matter experts