

Question: this book is intermediate financial management 12th Brigham/Daves. chapter3 Spreadsheet problem P. 124 Could you solve this problem with using Excel? Following is information for
this book is intermediate financial management 12th Brigham/Daves. chapter3 Spreadsheet problem P. 124
Could you solve this problem with using Excel?
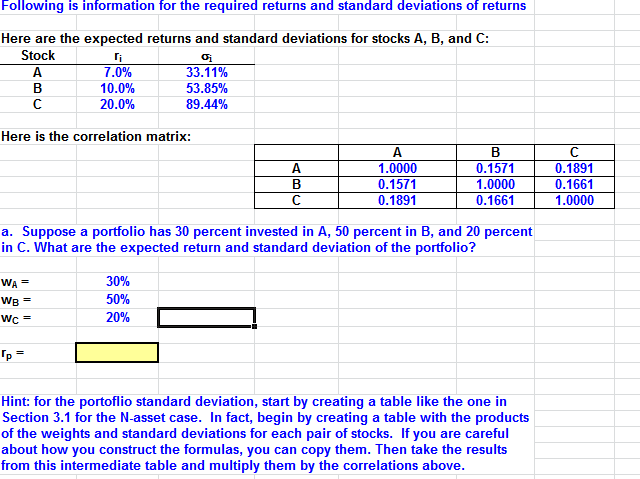
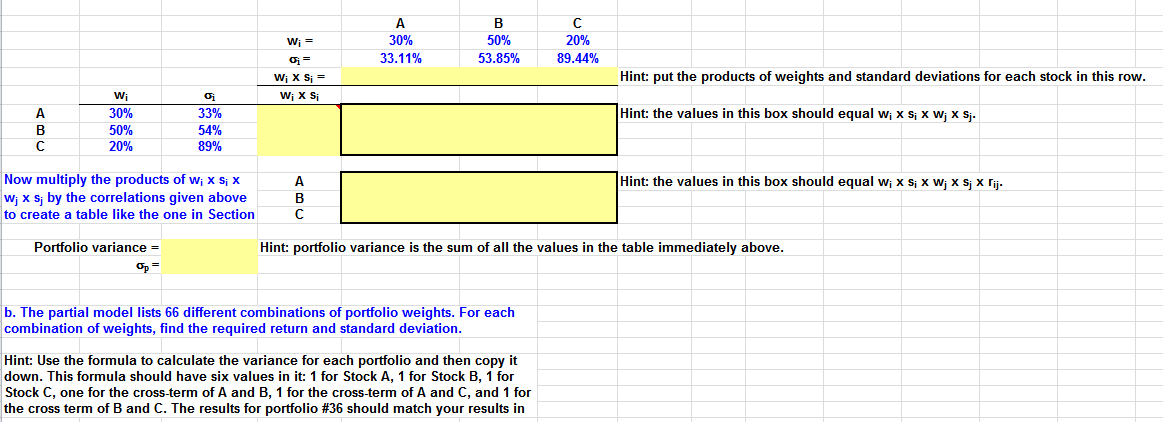
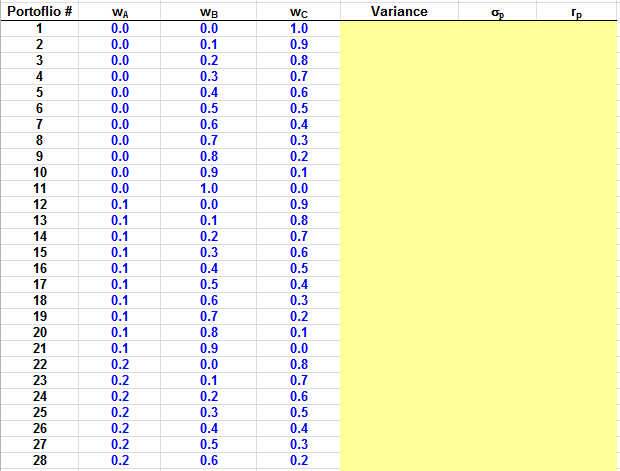
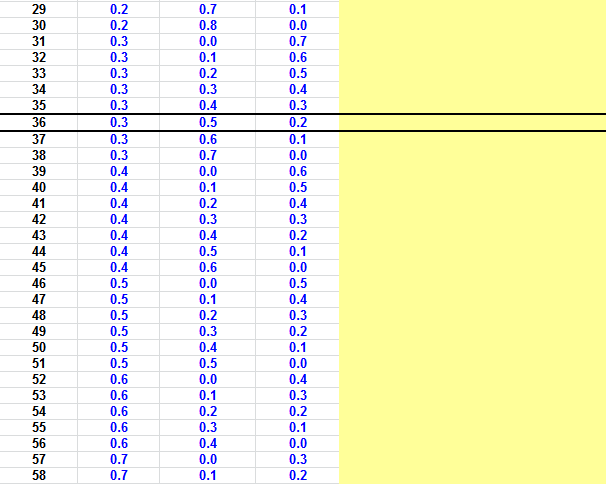
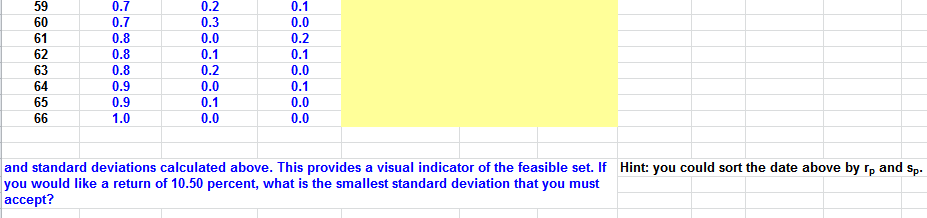
Following is information for the required returns and standard deviations of returns Here are the expected returns and standard deviations for stocks A, B, and C: Stock 7.0% 10.0% 20.0% 33.11% 53.85% 89.44% Here is the correlation matrix: 1.0000 0.1571 0.1891 0.1571 1.0000 0.1661 0.1891 0.1661 1.0000 a. Suppose a portfolio has 30 percent invested in A, 50 percent in B, and 20 percent in C. What are the expected return and standard deviation of the portfolio? 30% WA= We = WC= 20% Hint: for the portoflio standard deviation, start by creating a table like the one in Section 3.1 for the N-asset case. In fact, begin by creating a table with the products of the weights and standard deviations for each pair of stocks. If you are careful about how you construct the formulas, you can copy them. Then take the results from this intermediate table and multiply them by the correlations above
Step by Step Solution
There are 3 Steps involved in it

Get step-by-step solutions from verified subject matter experts