

Question: This chart shows the output gap in the U.S. from 1949 to 1973. what was the output gap in 1973? KNOWLEDGE CHECK This chart shows
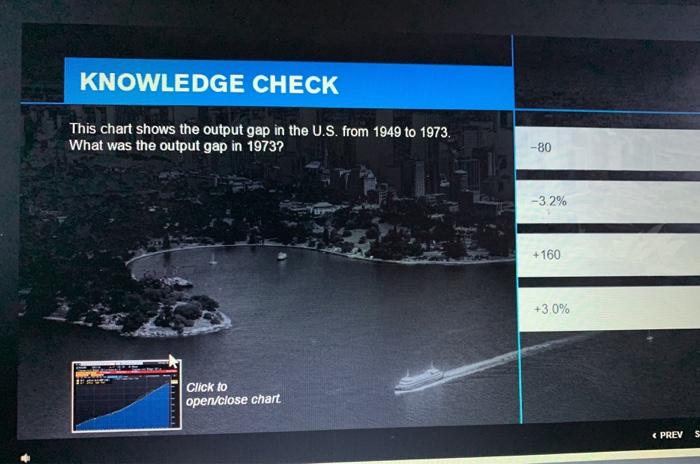
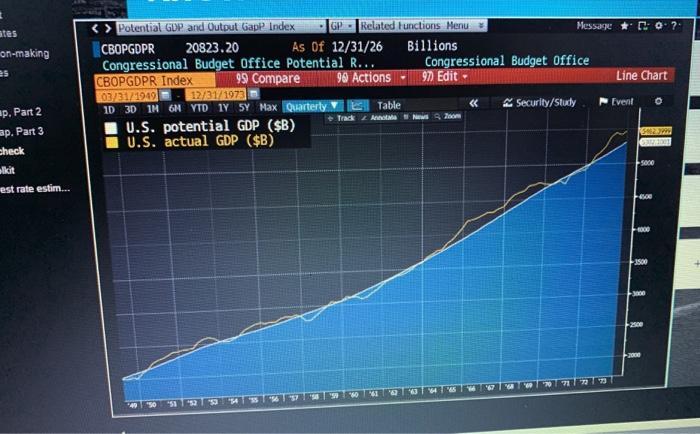
KNOWLEDGE CHECK This chart shows the output gap in the U.S. from 1949 to 1973. What was the output gap in 1973? -80 -3.2% + 160 +3,0% Click to open/close chart ( PREV
Step by Step Solution
★★★★★
3.49 Rating (159 Votes )
There are 3 Steps involved in it
1 Expert Approved Answer
Step: 1 Unlock

The o... View full answer
Question Has Been Solved by an Expert!
Get step-by-step solutions from verified subject matter experts
Step: 2 Unlock
Step: 3 Unlock