

Question: This chart shows the output gap in the U.S. from 1949 to 1973. what was the output gap in 1973? KNOWLEDGE CHECK This chart shows
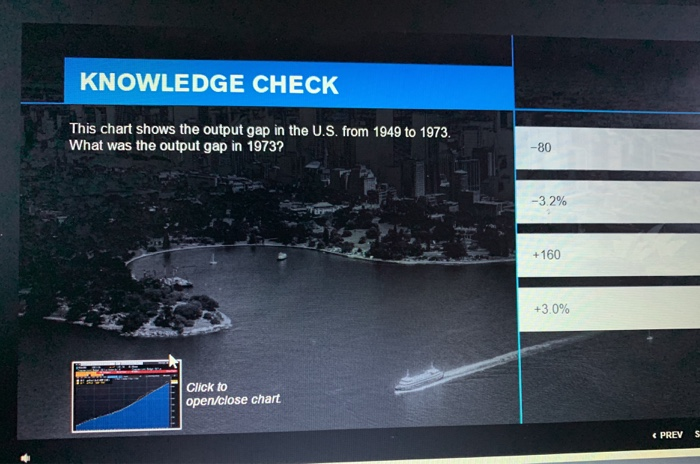
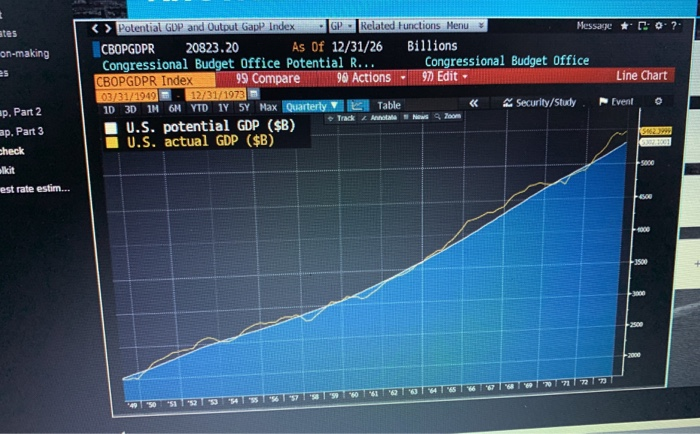
This chart shows the output gap in the U.S. from 1949 to 1973. what was the output gap in 1973?
KNOWLEDGE CHECK This chart shows the output gap in the U.S. from 1949 to 1973, What was the output gap in 1973? -80 -3.2% +160 +3.0% Click to open/close chart Potential GDP and Output Gap Index GP Related functions Menu Message t o CBOPGDPR 20823.20 As of 12/31/26 Billions Congressional Budget Office Potential R... Congressional Budget Office CBOPGDPR Index 99 Compare 90 Actions - 90 Edit Line Chart 03/31/1949 - 12/31/1973 1D 3D IM 6 YTD 1Y SY Max Quarterly Table
Step by Step Solution
There are 3 Steps involved in it
1 Expert Approved Answer
Step: 1 Unlock

Question Has Been Solved by an Expert!
Get step-by-step solutions from verified subject matter experts
Step: 2 Unlock
Step: 3 Unlock