

Question: This clustered bar chart represents the performance of a call center. The chart allows the IT manager to identify how often a problem is related
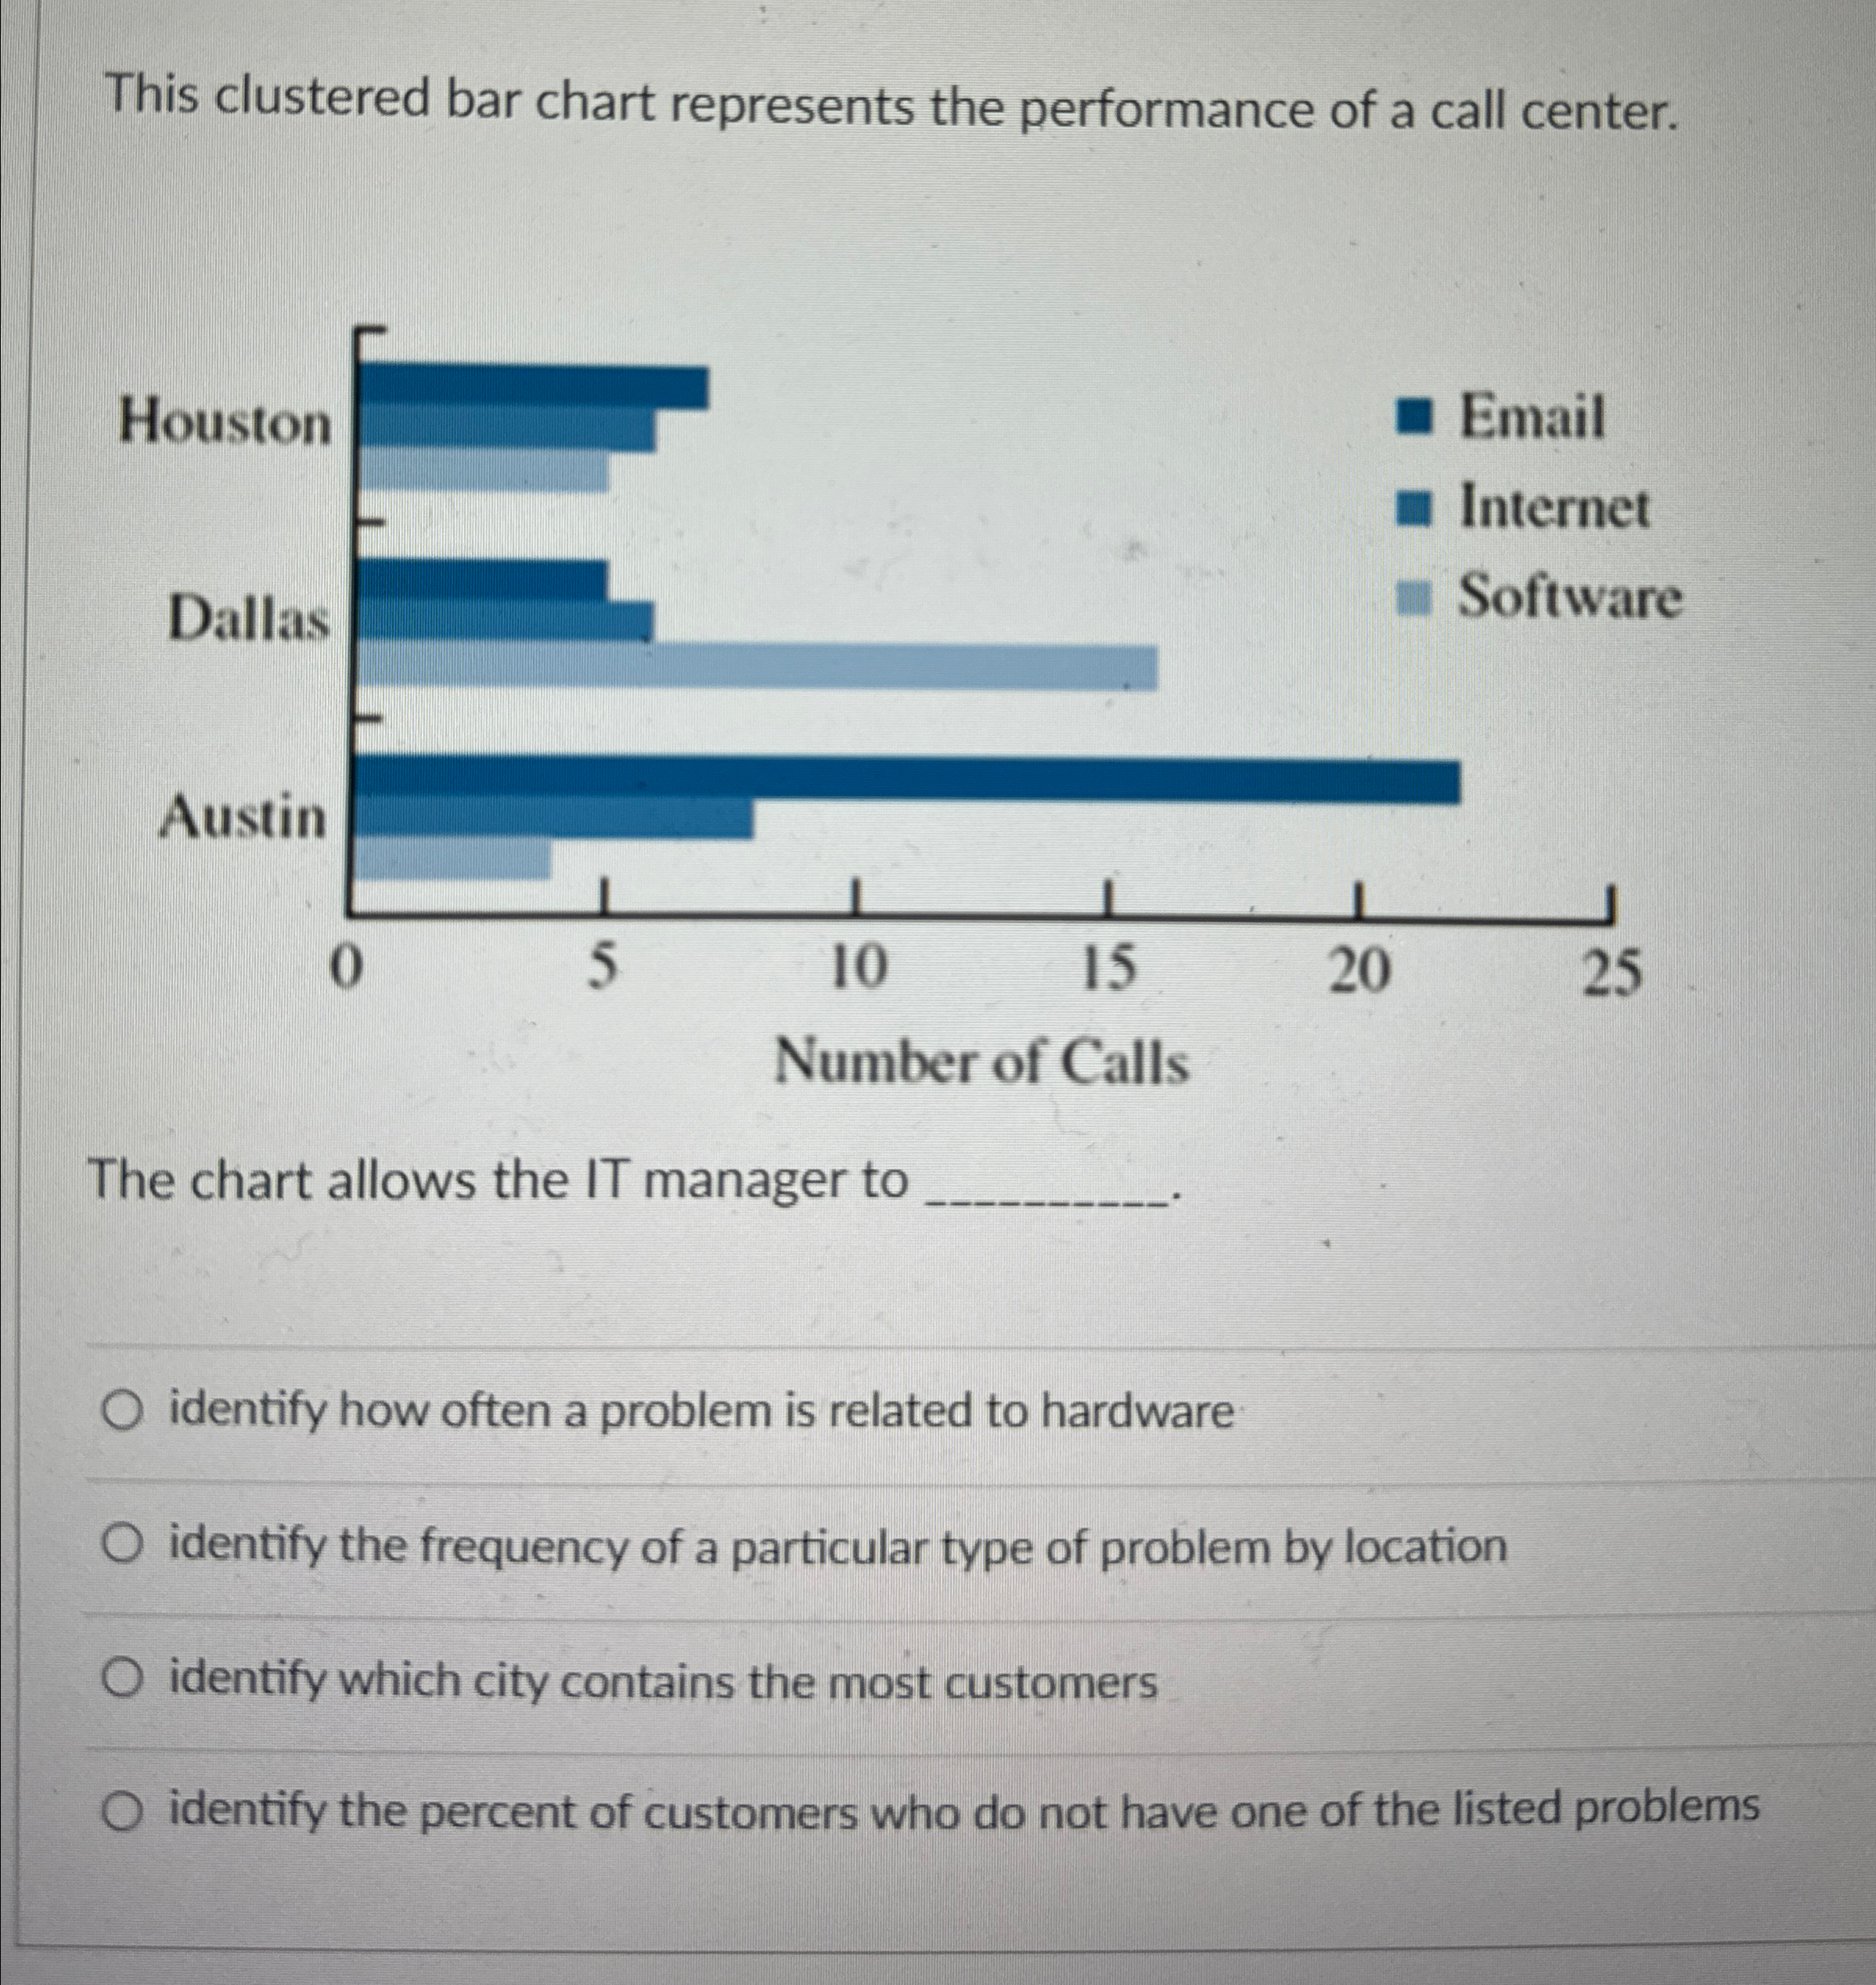
This clustered bar chart represents the performance of a call center.
The chart allows the IT manager to
identify how often a problem is related to hardware
identify the frequency of a particular type of problem by location
identify which city contains the most customers
identify the percent of customers who do not have one of the listed problems
Step by Step Solution
There are 3 Steps involved in it
1 Expert Approved Answer
Step: 1 Unlock

Question Has Been Solved by an Expert!
Get step-by-step solutions from verified subject matter experts
Step: 2 Unlock
Step: 3 Unlock