

Question: This code is written in python, the link for the file is below. It creates an interactive plot. I need to add error to this
This code is written in python, the link for the file is below. It creates an interactive plot. I need to add error to this plot. It would also be helpful if the error was shaded. Can the error be 0.4.
https://drive.google.com/file/d/17T1v7qoNUGWID4gGBIZQ54p7t-8AZhr-/view?usp=sharing
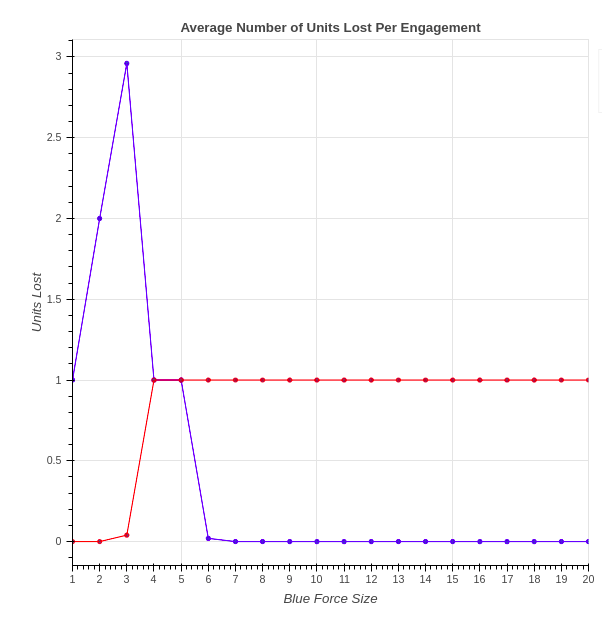
This is what the graph currently looks like.
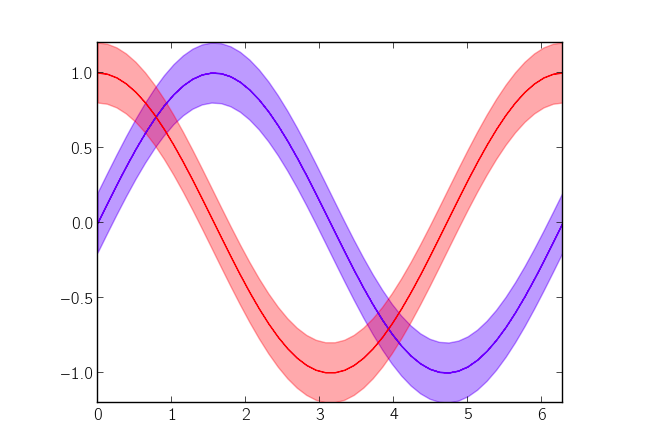
The graph below shows what I mean by shaded error. It would be awesome if the error culd be shaded, but if its not possible, the error bars are fine.
Average Number of Units Lost Per Engagement 2.5 1.5 0.5 1 2 3 4 5 6 789 10 11 12 13 14 15 16 17 18 19 20 Blue Force Size Average Number of Units Lost Per Engagement 2.5 1.5 0.5 1 2 3 4 5 6 789 10 11 12 13 14 15 16 17 18 19 20 Blue Force Size
Step by Step Solution
There are 3 Steps involved in it

Get step-by-step solutions from verified subject matter experts