

Question: This command will only show the number of boys baptized each year. R interprets the $ as saying go to the data frame that
This command will only show the number of boys baptized each year. R interprets the $ as saying go to the data frame that comes before me and find the variable that comes after me
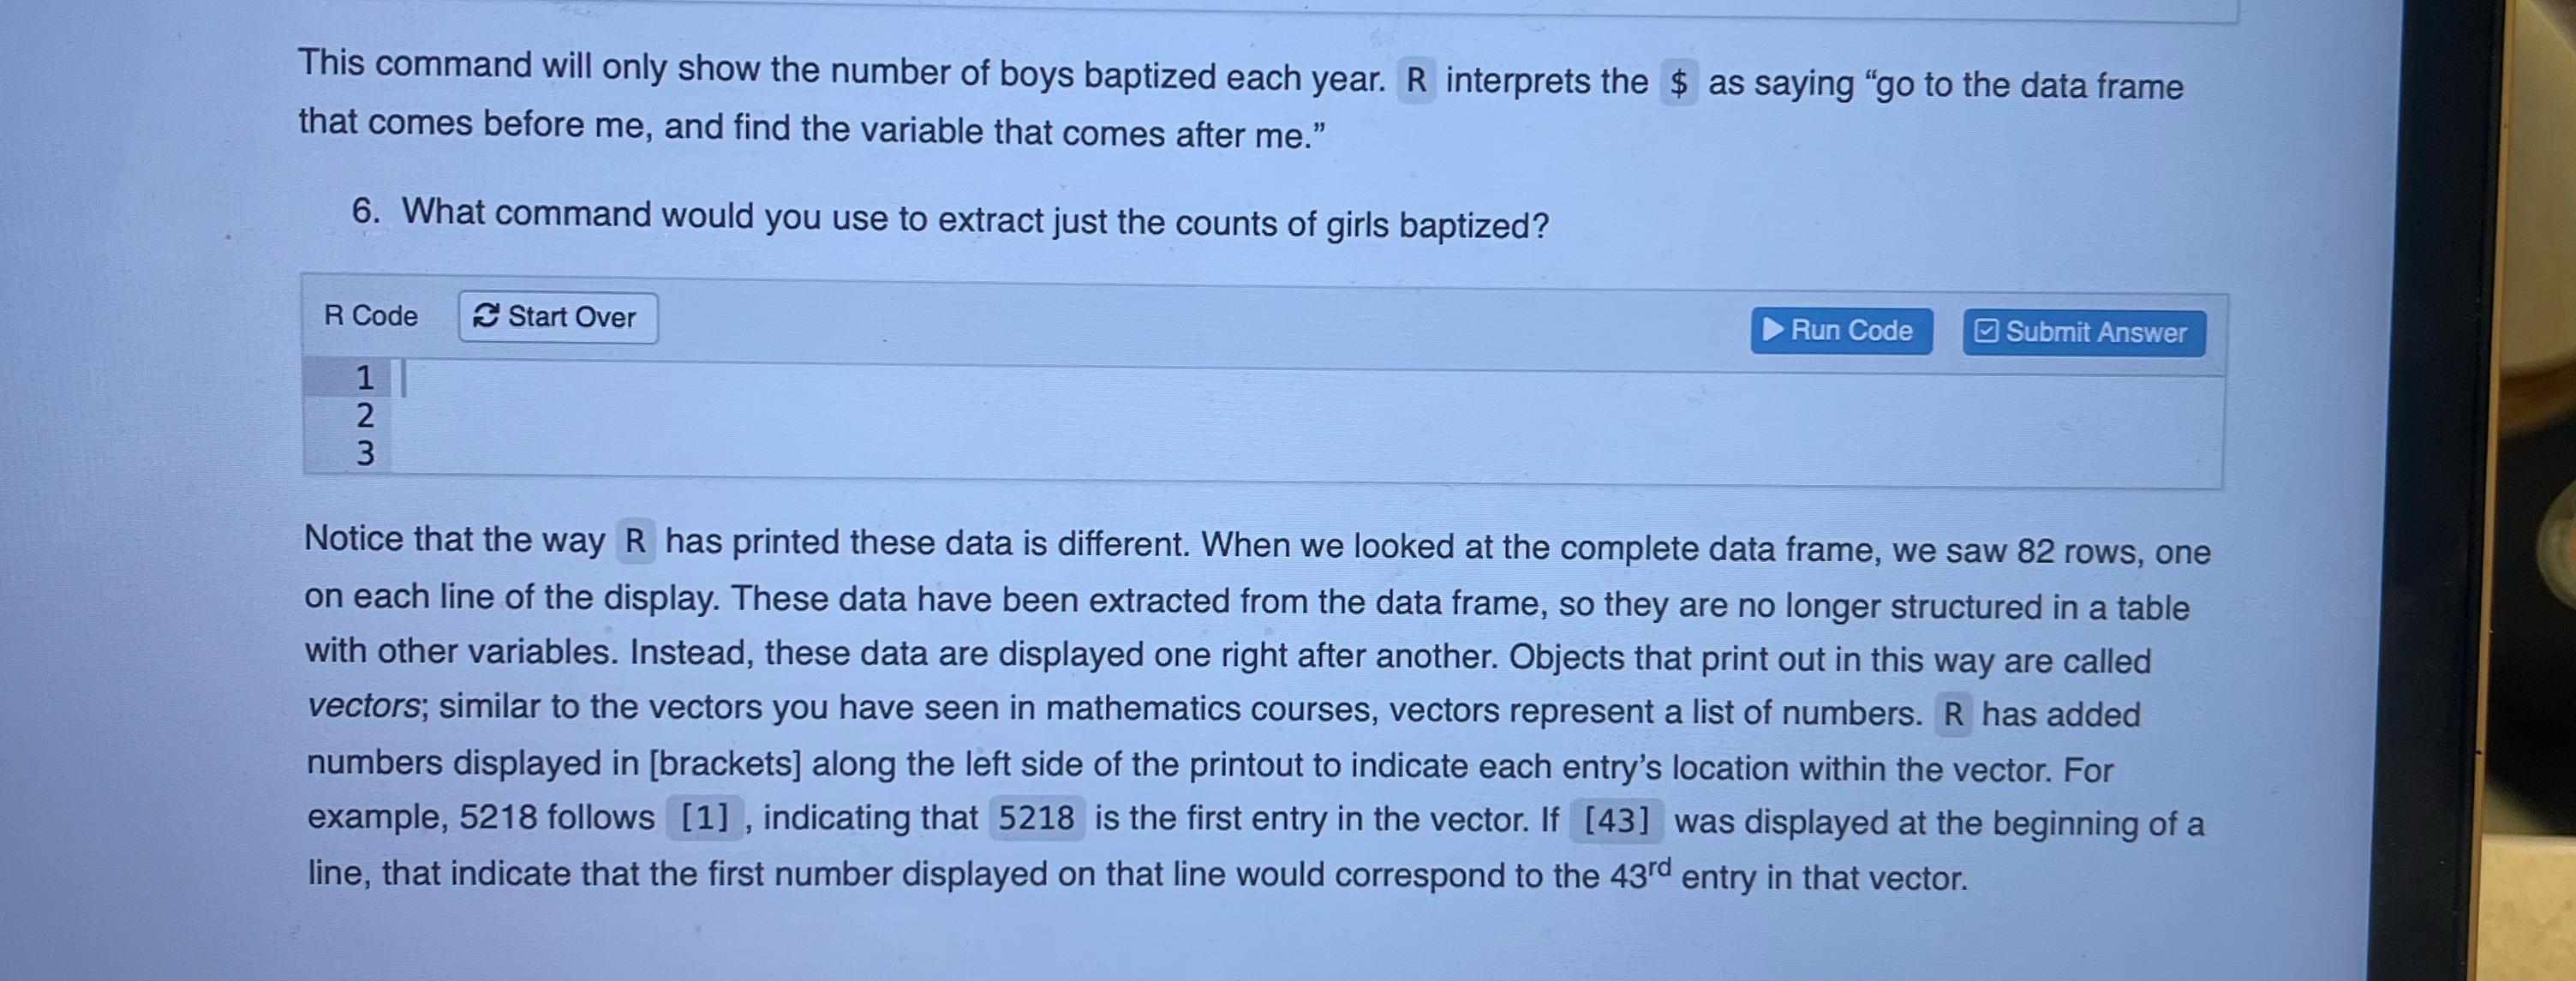
What command would you use to extract just the counts of girls baptized?
R Co
Notice that the way has printed these data is different. When we looked at the complete data frame, we saw rows, one on each line of the display. These data have been extracted from the data frame, so they are no longer structured in a table with other variables. Instead, these data are displayed one right after another. Objects that print out in this way are called vectors; similar to the vectors you have seen in mathematics courses, vectors represent a list of numbers. has added numbers displayed in brackets along the left side of the printout to indicate each entry's location within the vector. For example, follows indicating that is the first entry in the vector. If was displayed at the beginning of a line, that indicate that the first number displayed on that line would correspond to the entry in that vector.This command does display the data for us however, printing the whole dataset in the console is not that useful. One advantage of RStudio is that it comes with a builtin data viewer. The Environment tab in the upper right pane lists the objects in your environment. Clicking on the name arbuthnot will open up a Data Viewer tab next to your R Markdown file, which provides an alternative display of the data set. This display should feel similar to viewing data in Excel, where you are able to scroll through the dataset to inspect it However, unlike Excel, you will not be able to edit the data in this tab. Once you are done viewing the data, You can close this tab by clicking on the in the upper left hand corner.
When inspecting the data, you should see four columns of numbers and rows. Each row represents a different year that Arbuthnot collected data. The first entry in each row is the row number an index we can use to access the data from individual years if we want the second is the year, and the third and fourth are the numbers of boys and girls baptized that year, respectively. Use the scrollbar on the right side of the console window to examine the complete data set.
Note that the row numbers in the first column are not part of Arbuthnot's data. adds these row numbers as part of its printout to help you make visual comparisons. You can think of them as the index that you see on the left side of a spreadsheet. In fact, the comparison of the data to a spreadsheet will generally be helpful. R has stored Arbuthnot's data in an object similar to a spreadsheet or a table, which calls a data frame.
You can see the dimensions of this data frame as well as the names of the variables and the first few observations by inserting the name of the dataset into the pse function, as seen below:
Step by Step Solution
There are 3 Steps involved in it
1 Expert Approved Answer
Step: 1 Unlock

Question Has Been Solved by an Expert!
Get step-by-step solutions from verified subject matter experts
Step: 2 Unlock
Step: 3 Unlock